Automation Workflow
The Workflow History and Email Overview pages allow you to monitor, analyze, and troubleshoot how your automation workflows and emails are performing.
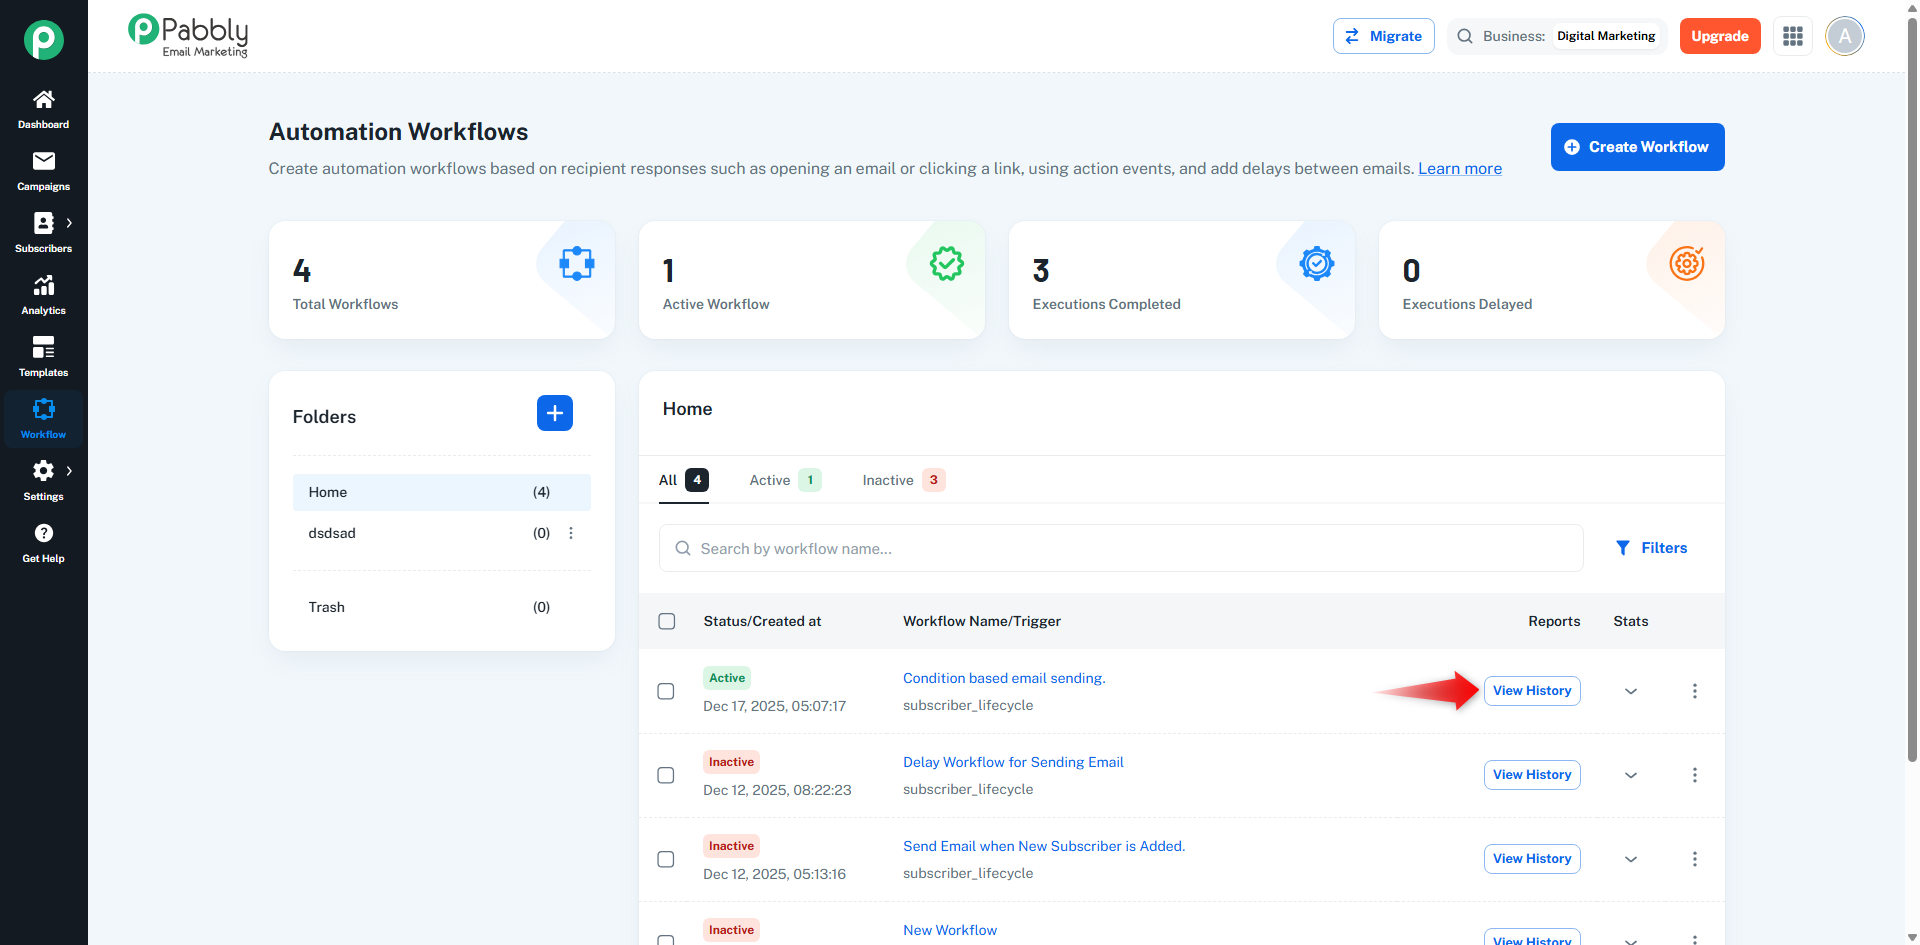
Navigate to Automation Workflows.
Locate the workflow you want to analyze.
Click on the View History button next to the workflow.
➡️ You will be redirected to the Workflow History page for that specific workflow.
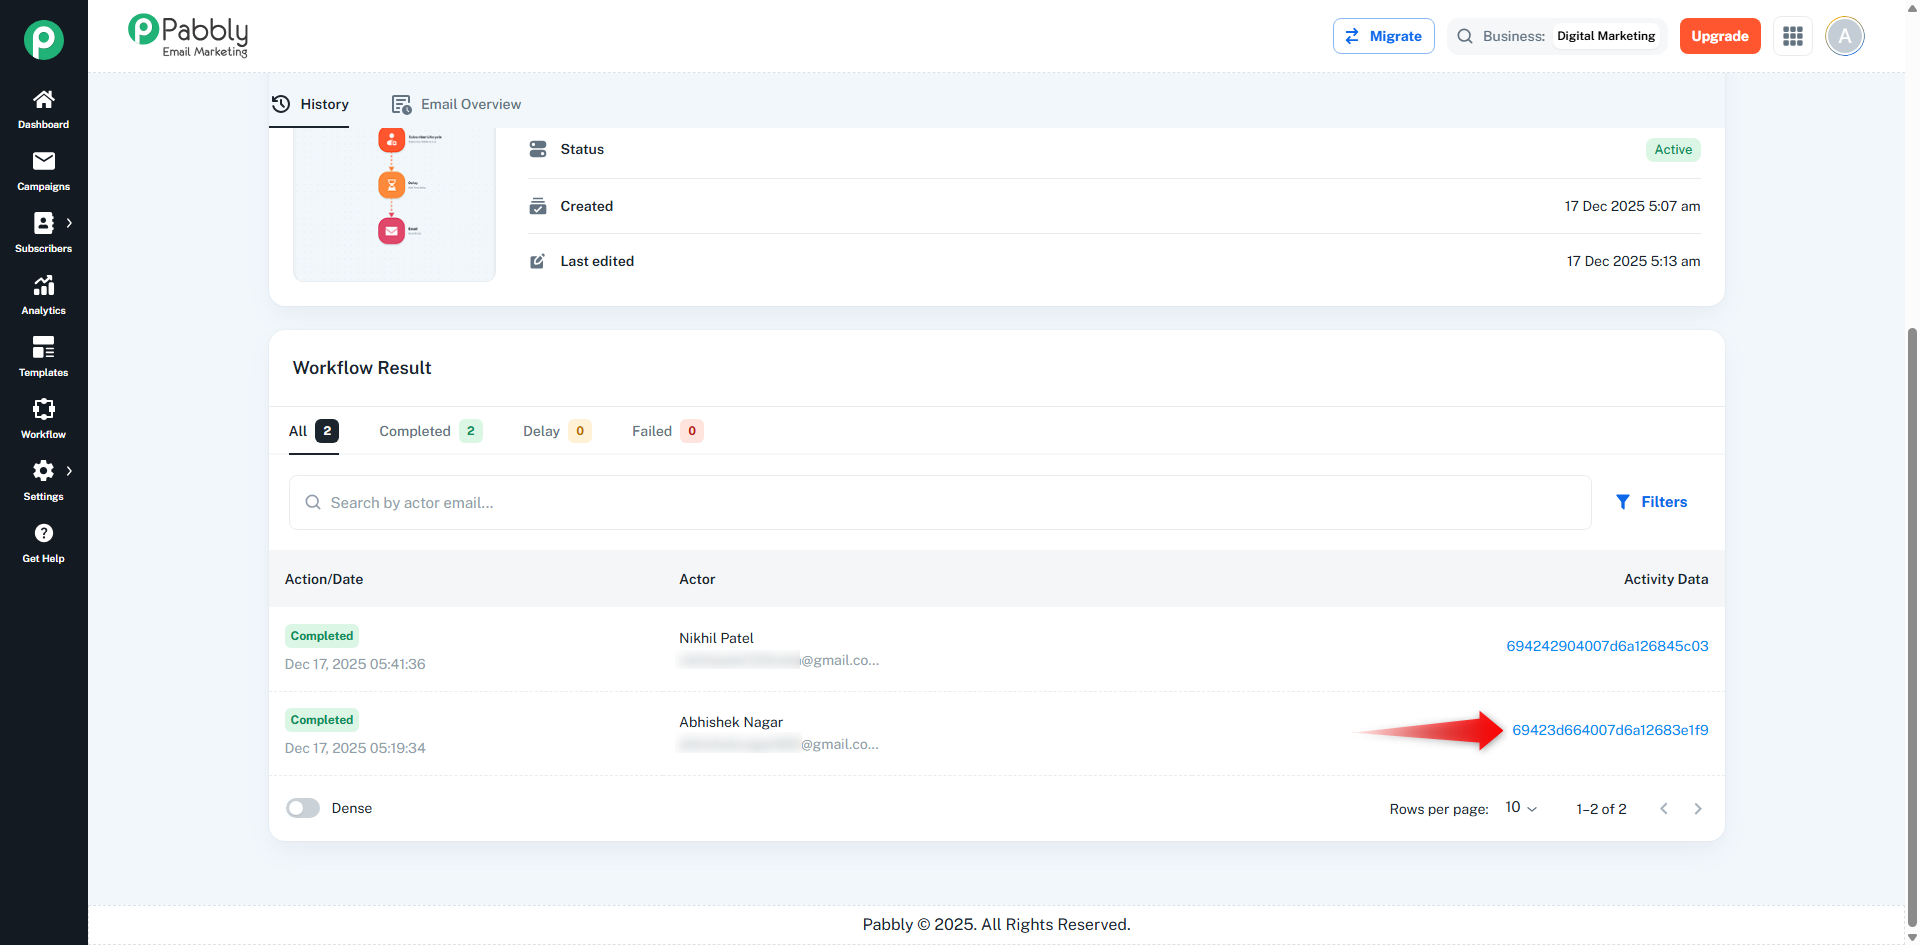
The Workflow History page provides a detailed view of every execution of the selected workflow.
At the top of the page, you’ll see execution statistics:
Completed
Shows the number and percentage of workflows that executed successfully.
Delay
Displays workflows that are currently paused at a Delay node.
Failed
Indicates executions that failed due to an error or condition mismatch.
These cards help you quickly understand the overall health of the workflow.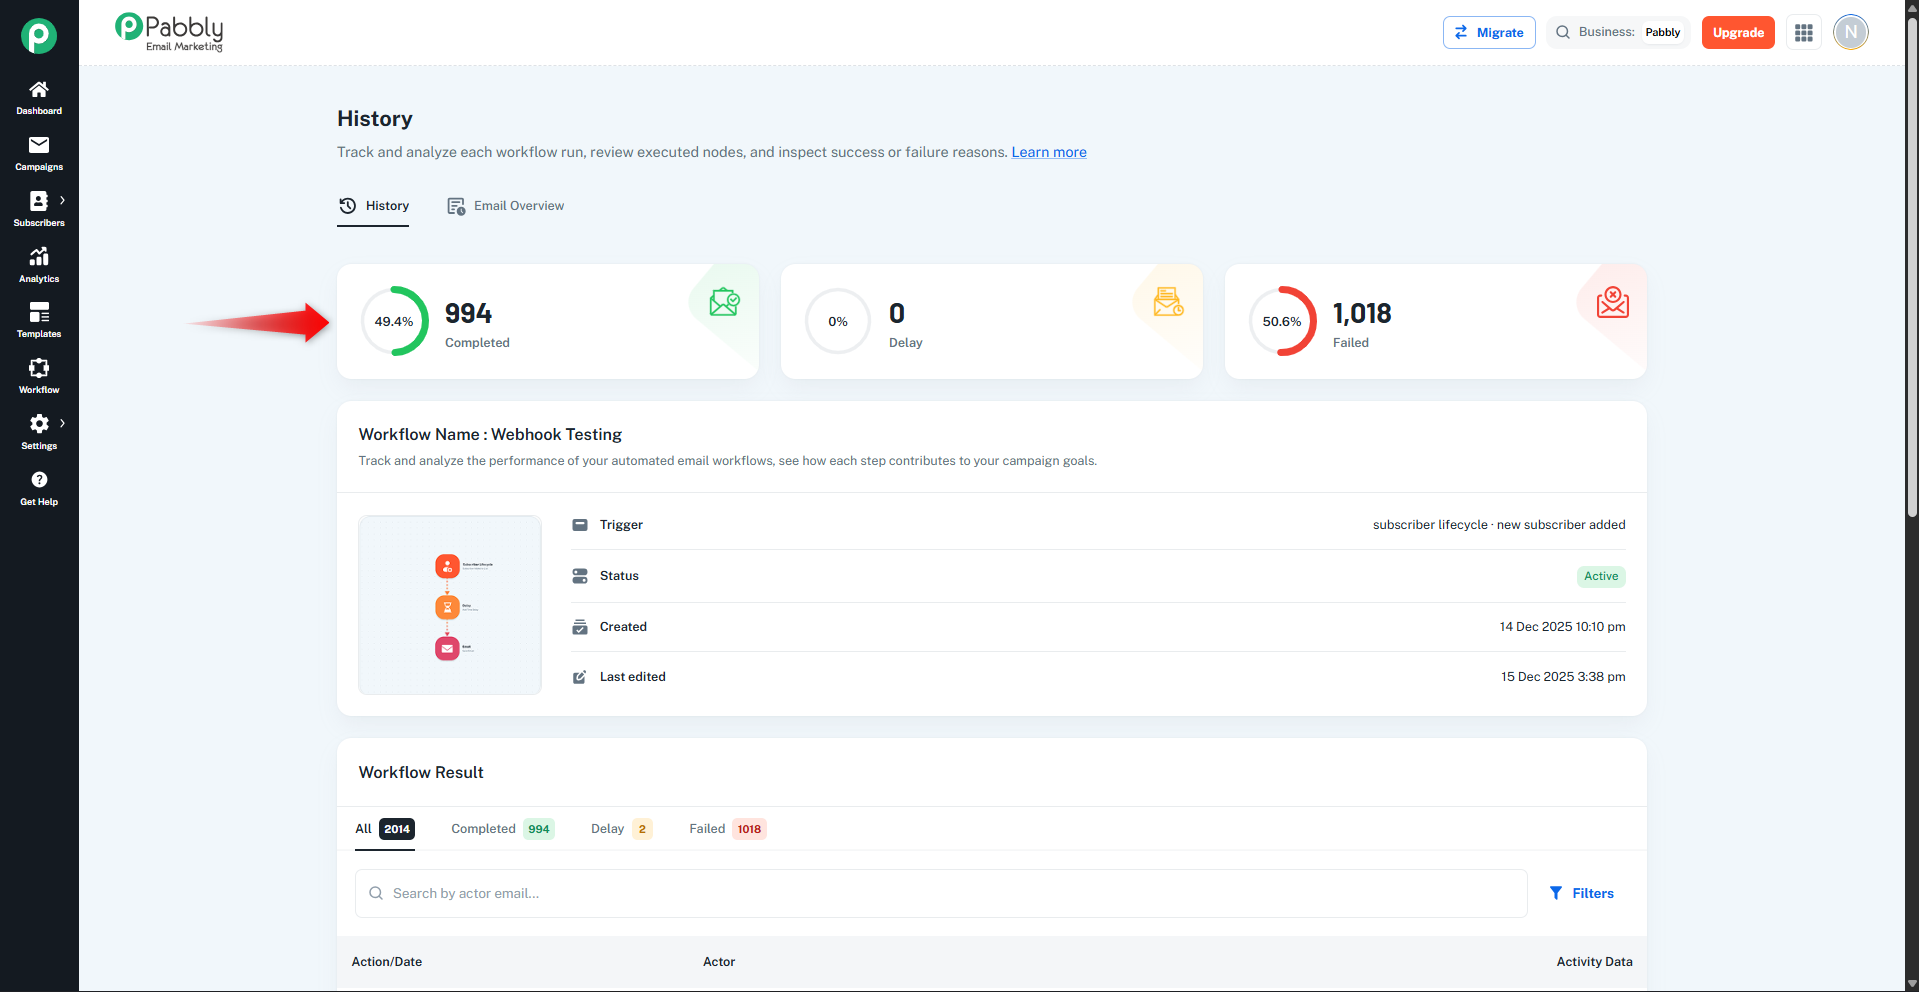
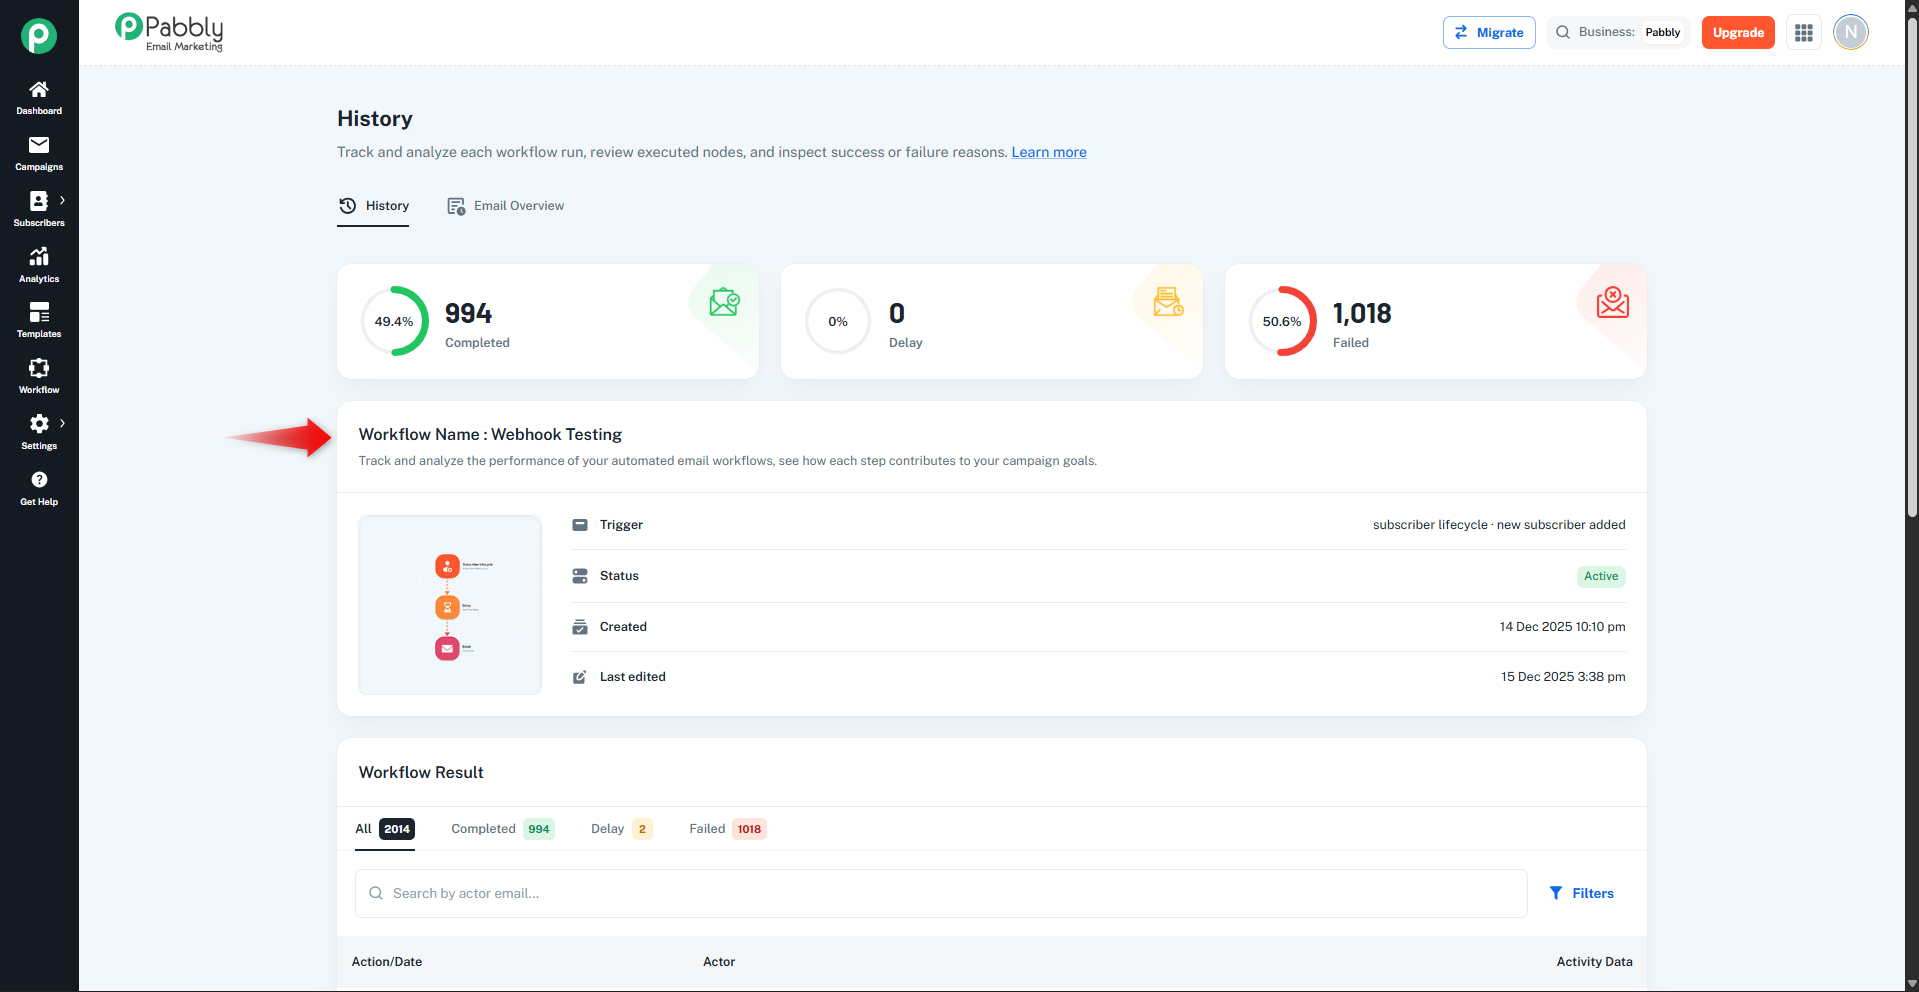
This section displays key workflow details:
Workflow Name
Trigger Type (e.g., Subscriber Lifecycle → New Subscriber Added)
Workflow Status (Active / Inactive)
Created Date
Last Edited Date
It helps you confirm which workflow version is currently being tracked.
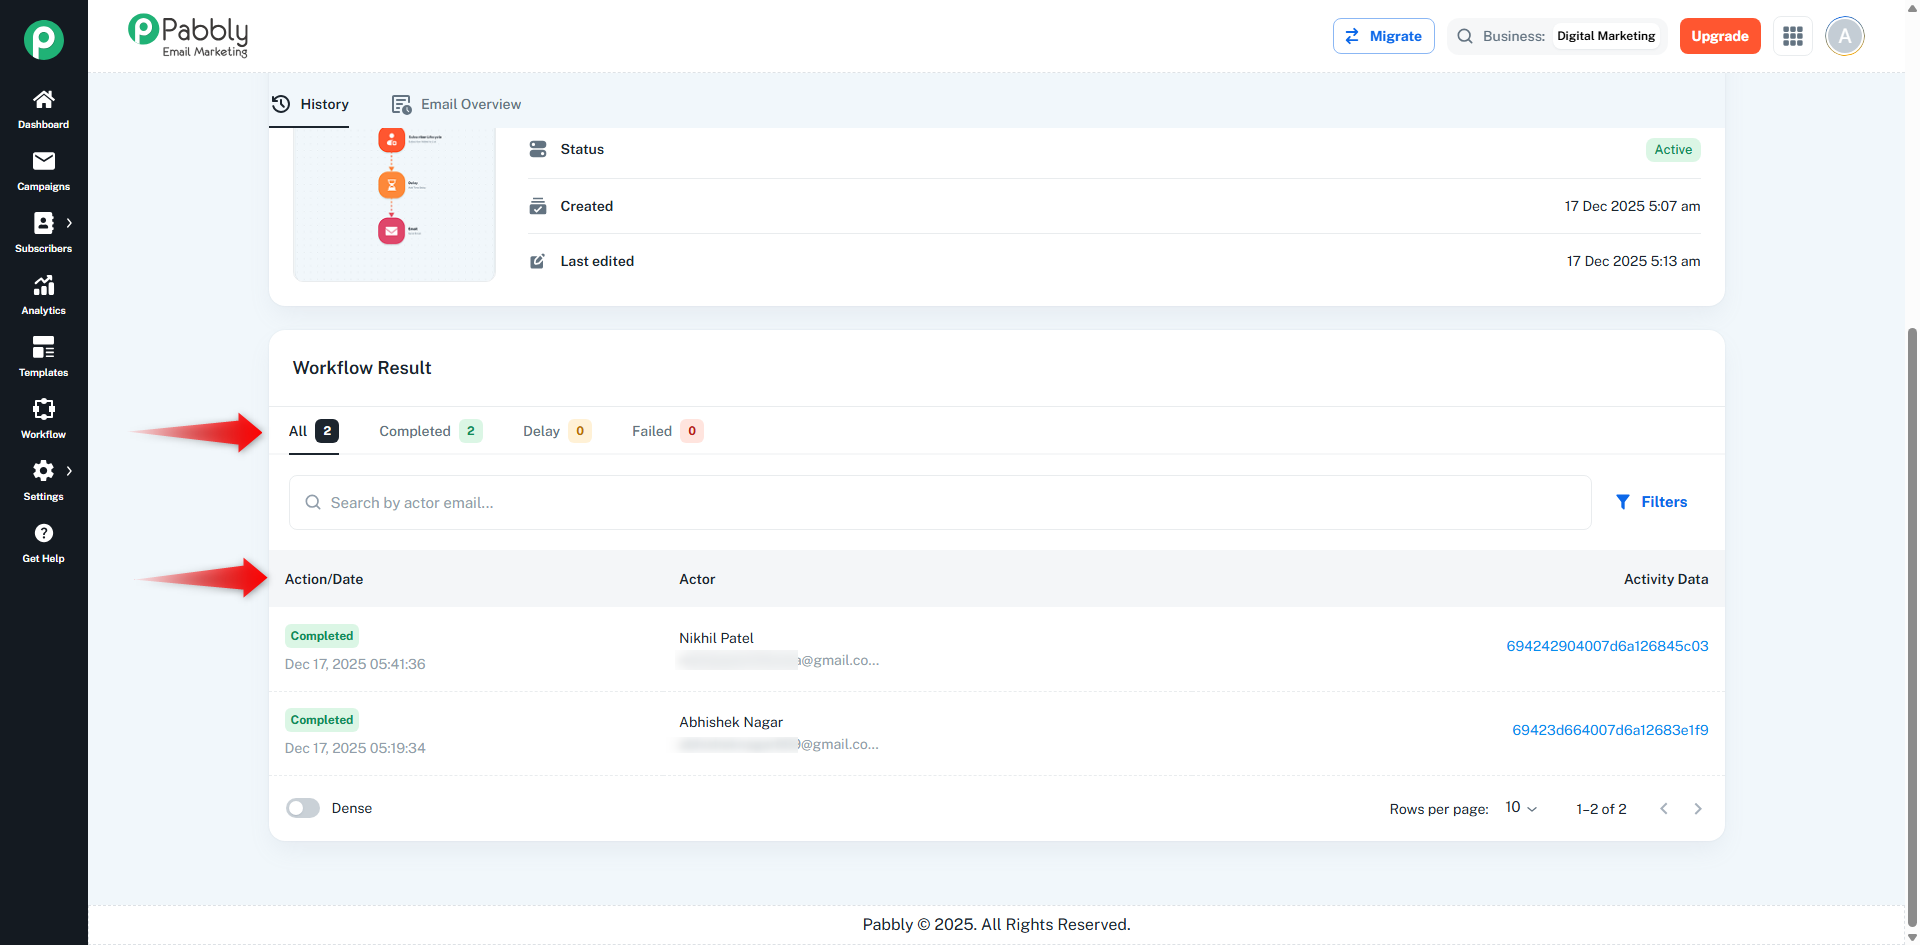
This section lists each execution instance of the workflow.
All – Shows all executions
Completed – Successfully completed runs
Delay – Executions waiting at a delay step
Failed – Failed executions
Action / Date
Shows the execution status and the time the workflow ran.
Actor
Displays the subscriber for whom the workflow was executed.
Activity Data
A unique History ID for each execution.
You can use the search bar to find executions by subscriber email.
Click on any Activity Data (History ID) from the list.
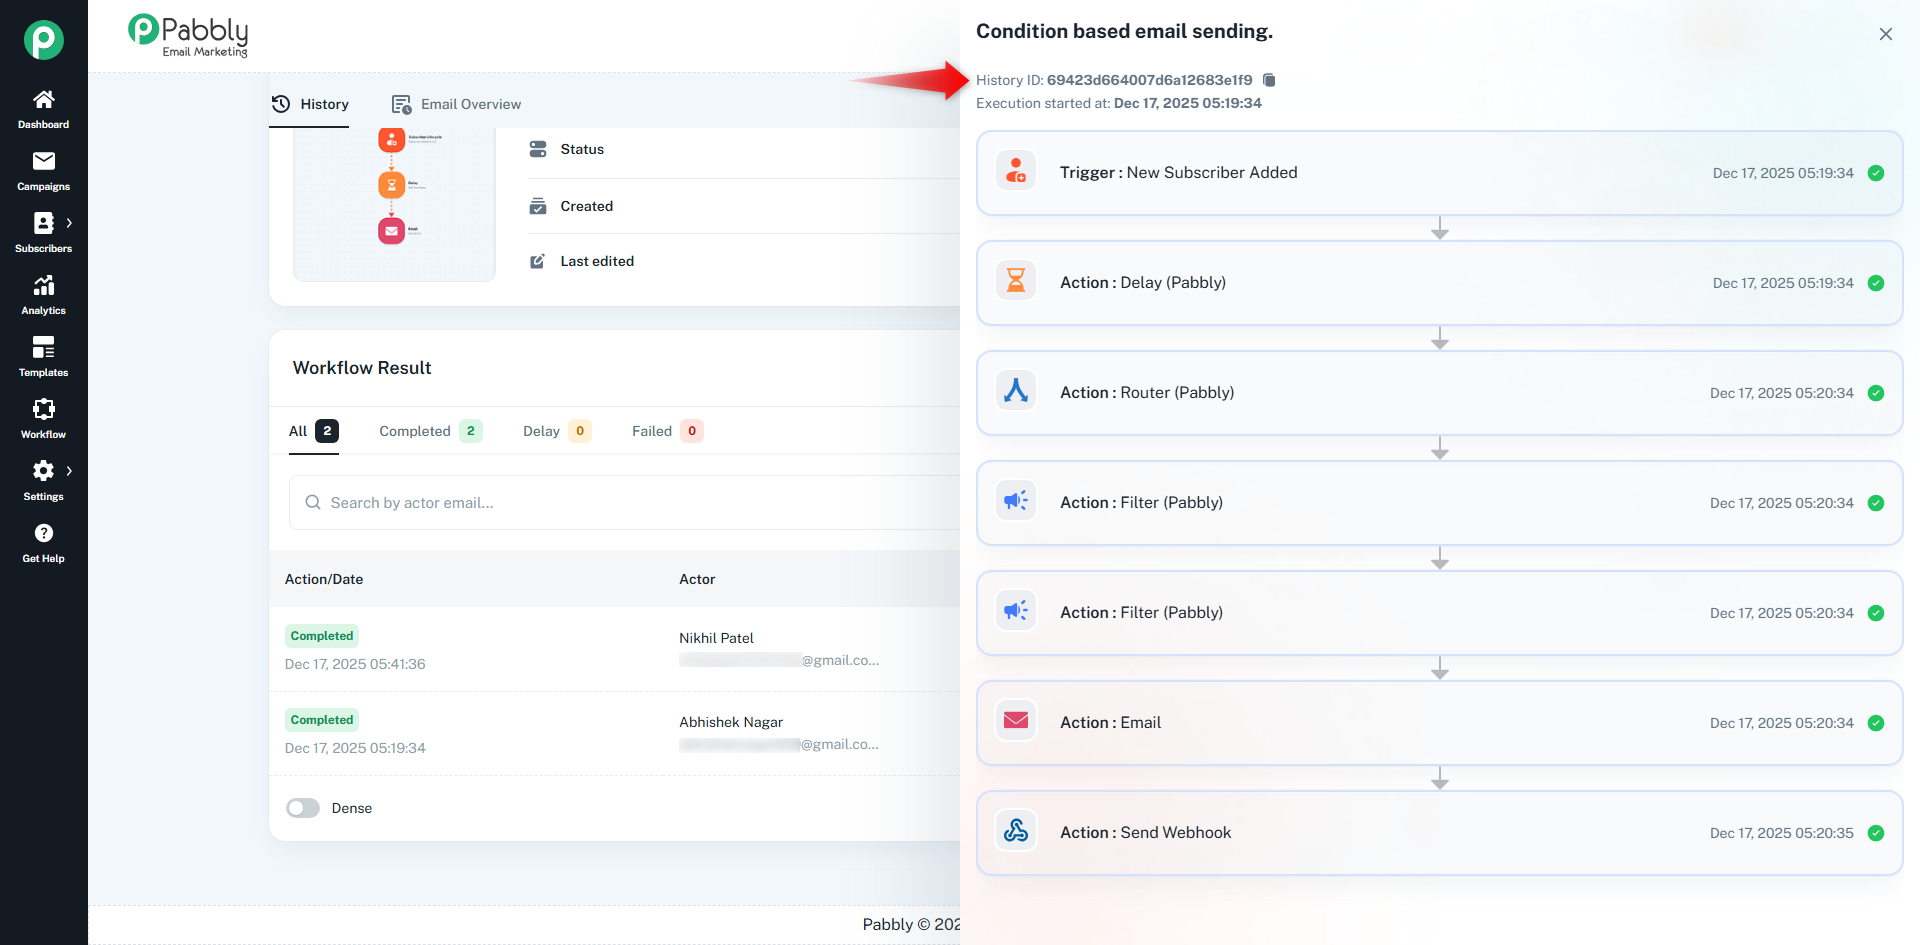
A detailed execution panel opens on the right side.
This panel shows the step-by-step execution flow of the workflow.
History ID
Execution Start Time
Trigger Event
Each Action Node Executed, including:
Delay (Pabbly)
Router (Pabbly)
Filter (Pabbly)
Send Webhook
Each step includes:
Execution timestamp
Status indicator (Success / Failed)
This view is extremely useful for debugging and understanding workflow behavior.
The Email Overview tab provides performance insights for emails sent through automation workflows.
To access it:
➡️ Click on the Email Overview tab at the top of the History page.
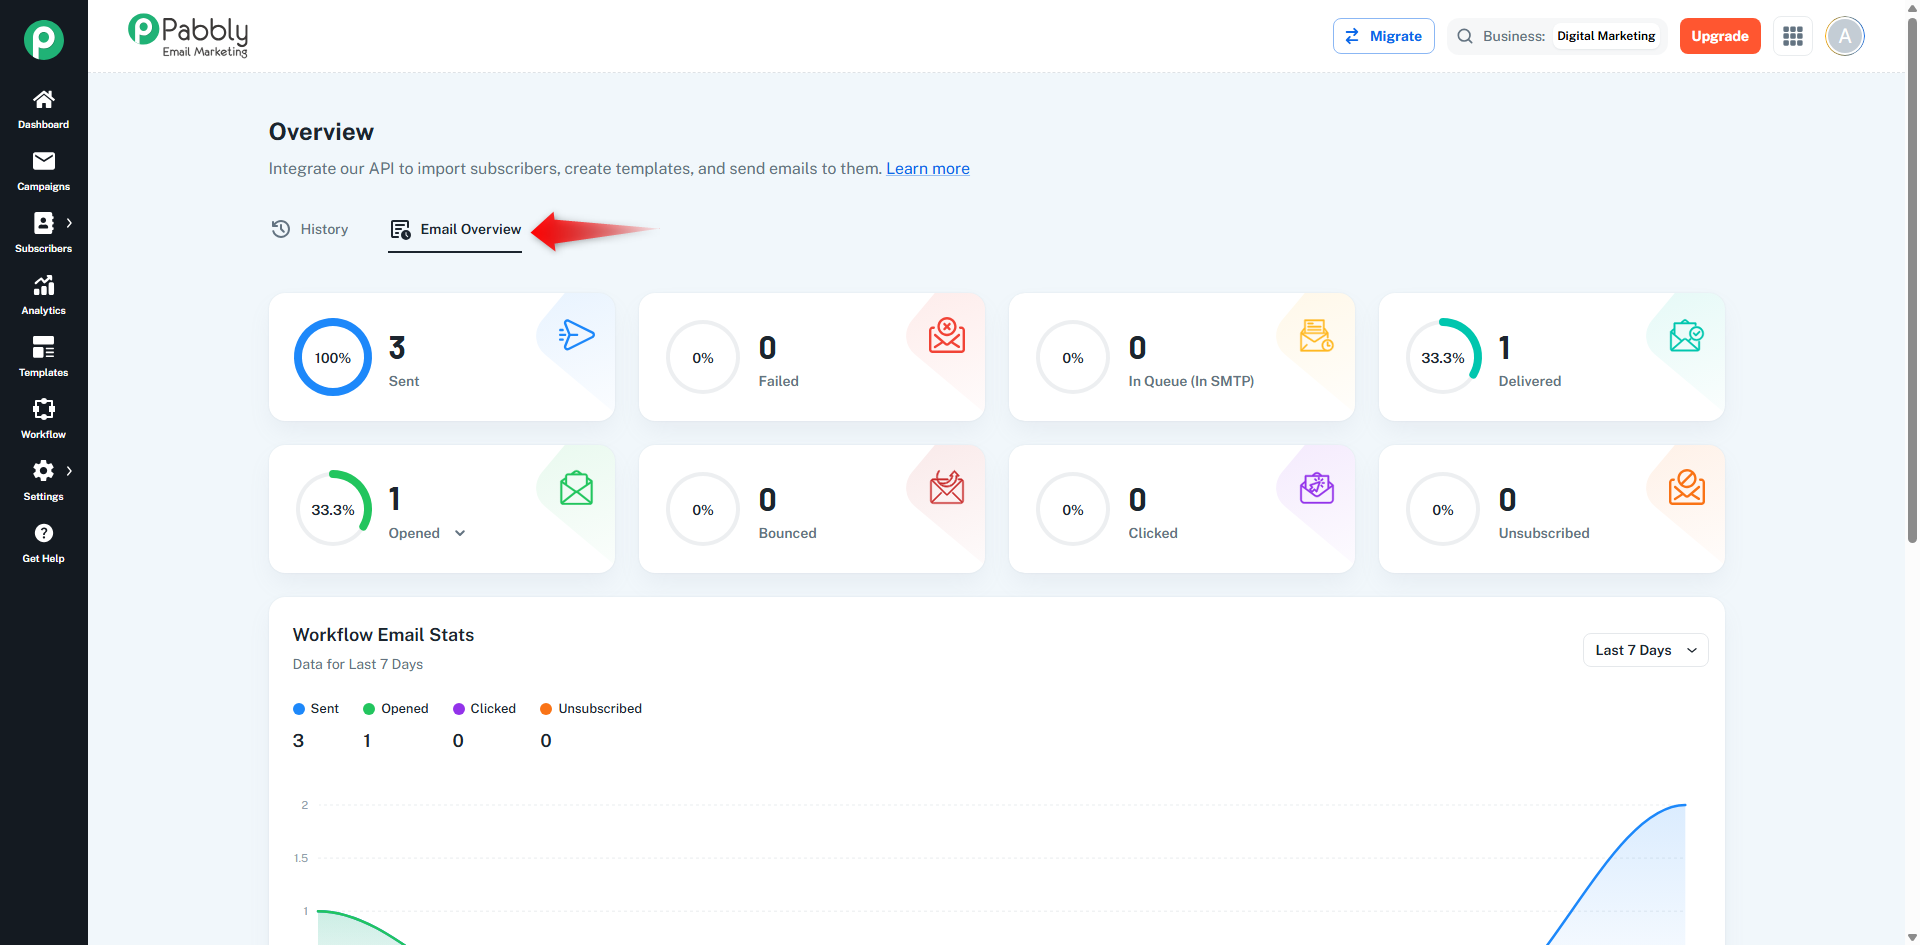
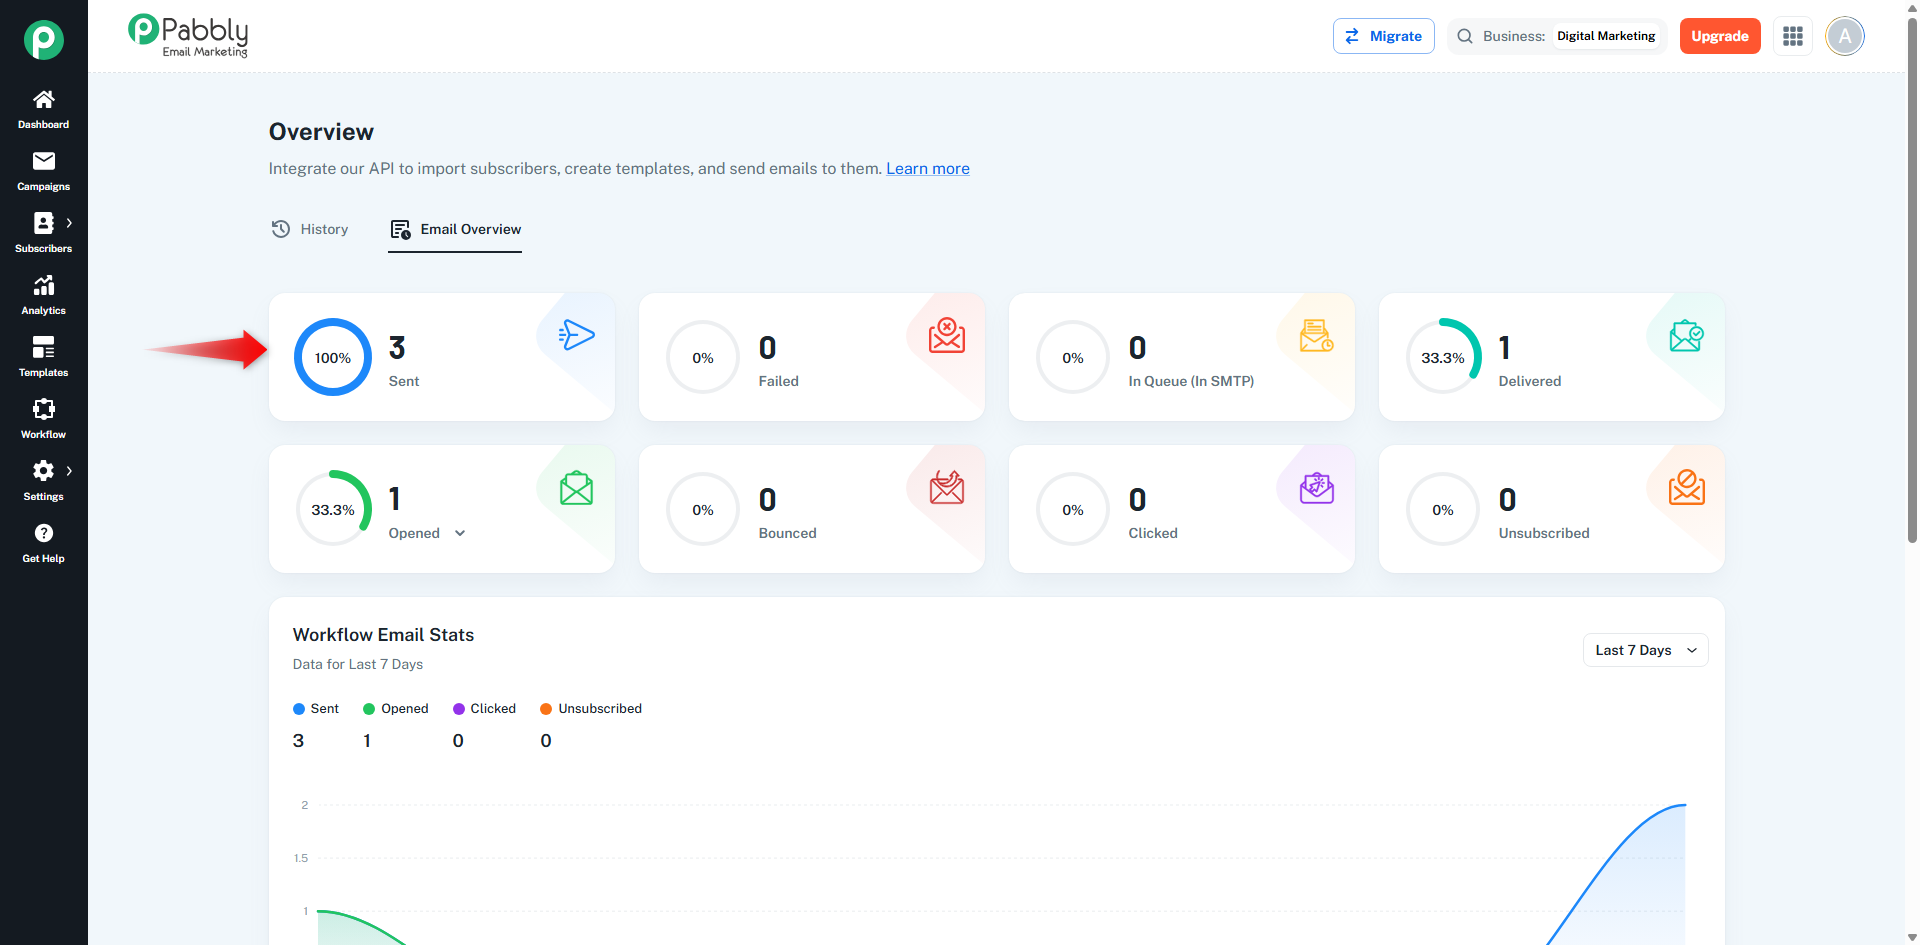
At the top, you’ll see key email metrics:
Sent – Total emails sent
Delivered – Successfully delivered emails
Opened – Emails opened by recipients
Clicked – Link clicks inside emails
Bounced – Failed deliveries
Unsubscribed – Subscribers who opted out
Failed – Emails that failed to send
In Queue (SMTP) – Emails waiting to be sent
These metrics give you a quick performance snapshot.
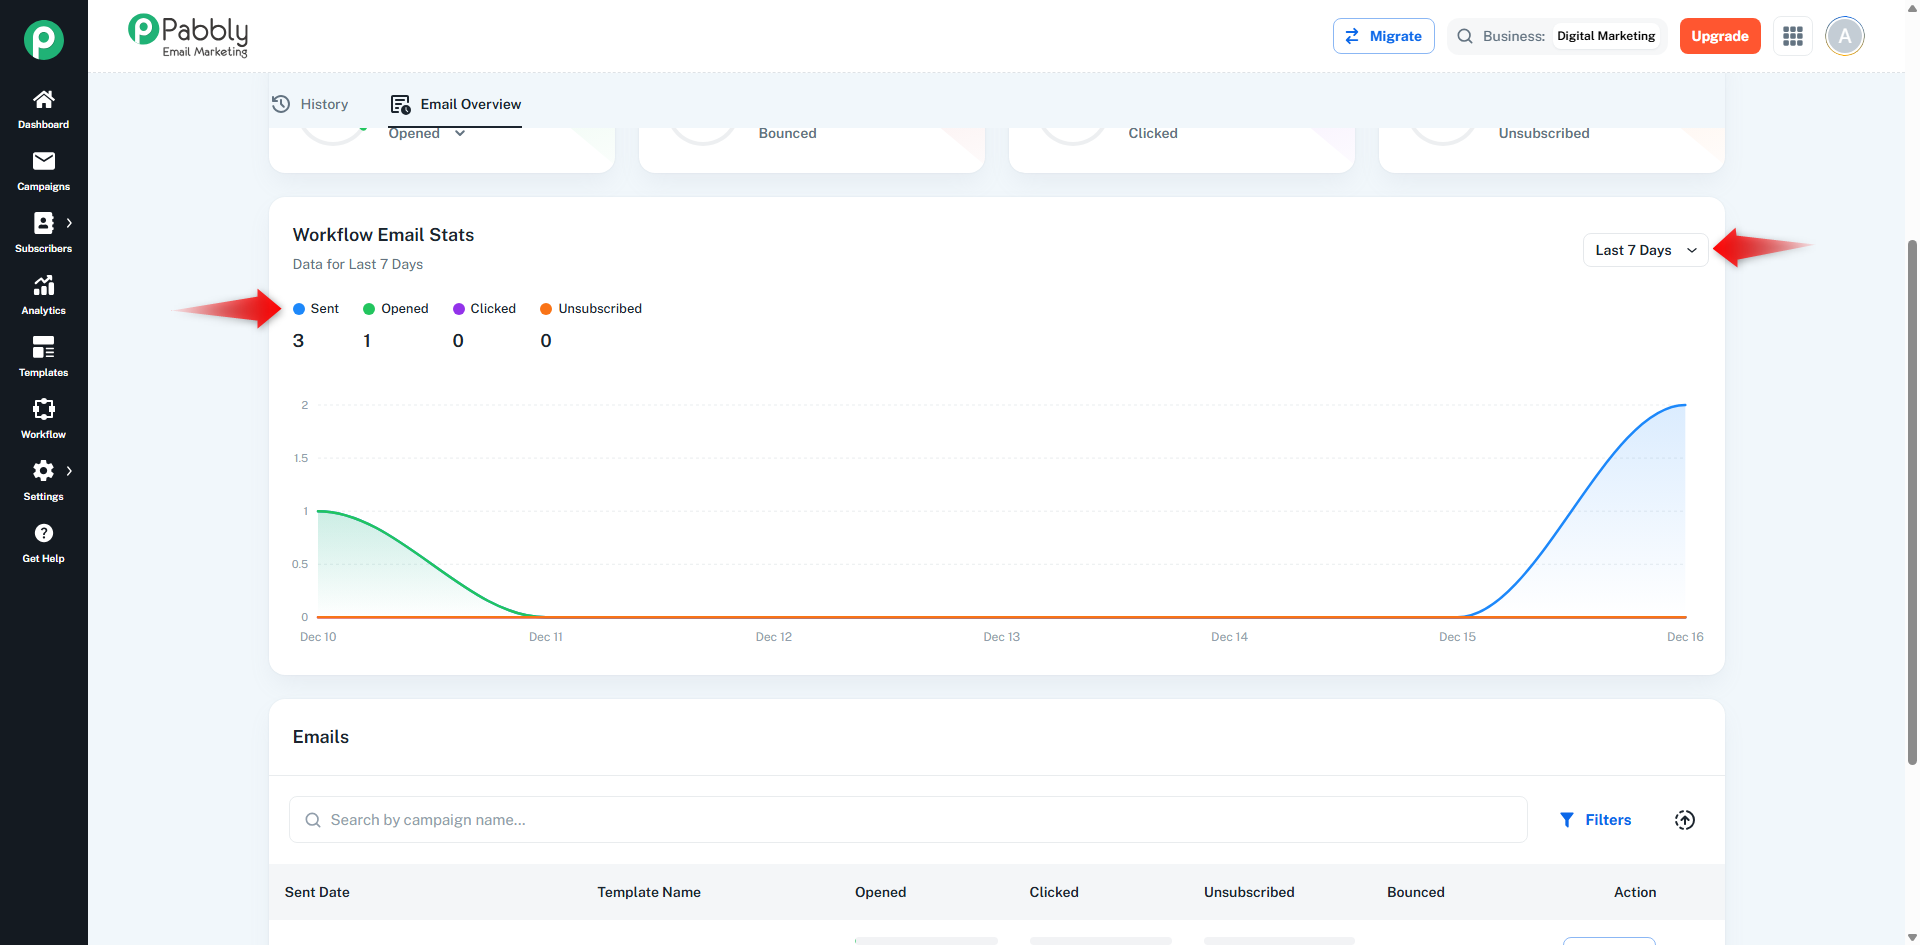
This graph shows email activity over time:
Sent
Opened
Clicked
Unsubscribed
You can filter data by time range (e.g., Last 7 Days).
This table lists all email campaigns triggered by the workflow.
Sent Date
Template Name
Opened Count
Clicked Count
Unsubscribed Count
Bounced Count
Action
Click View Report to see detailed analytics for a specific email campaign.
Workflow History helps track and debug workflow executions at a subscriber level.
Execution Details show exactly how each node performed.
Email Overview provides clear insights into email delivery and engagement.
Together, these pages ensure transparency, performance tracking, and easy troubleshooting for automation workflows.