Pabbly Email Marketing
 Pabbly Email Marketing Team•Updated Oct 24, 2026•2 min read
The Analytics page displays email campaign performance metrics and insights. It includes statistics cards, charts, and a detailed campaign table.
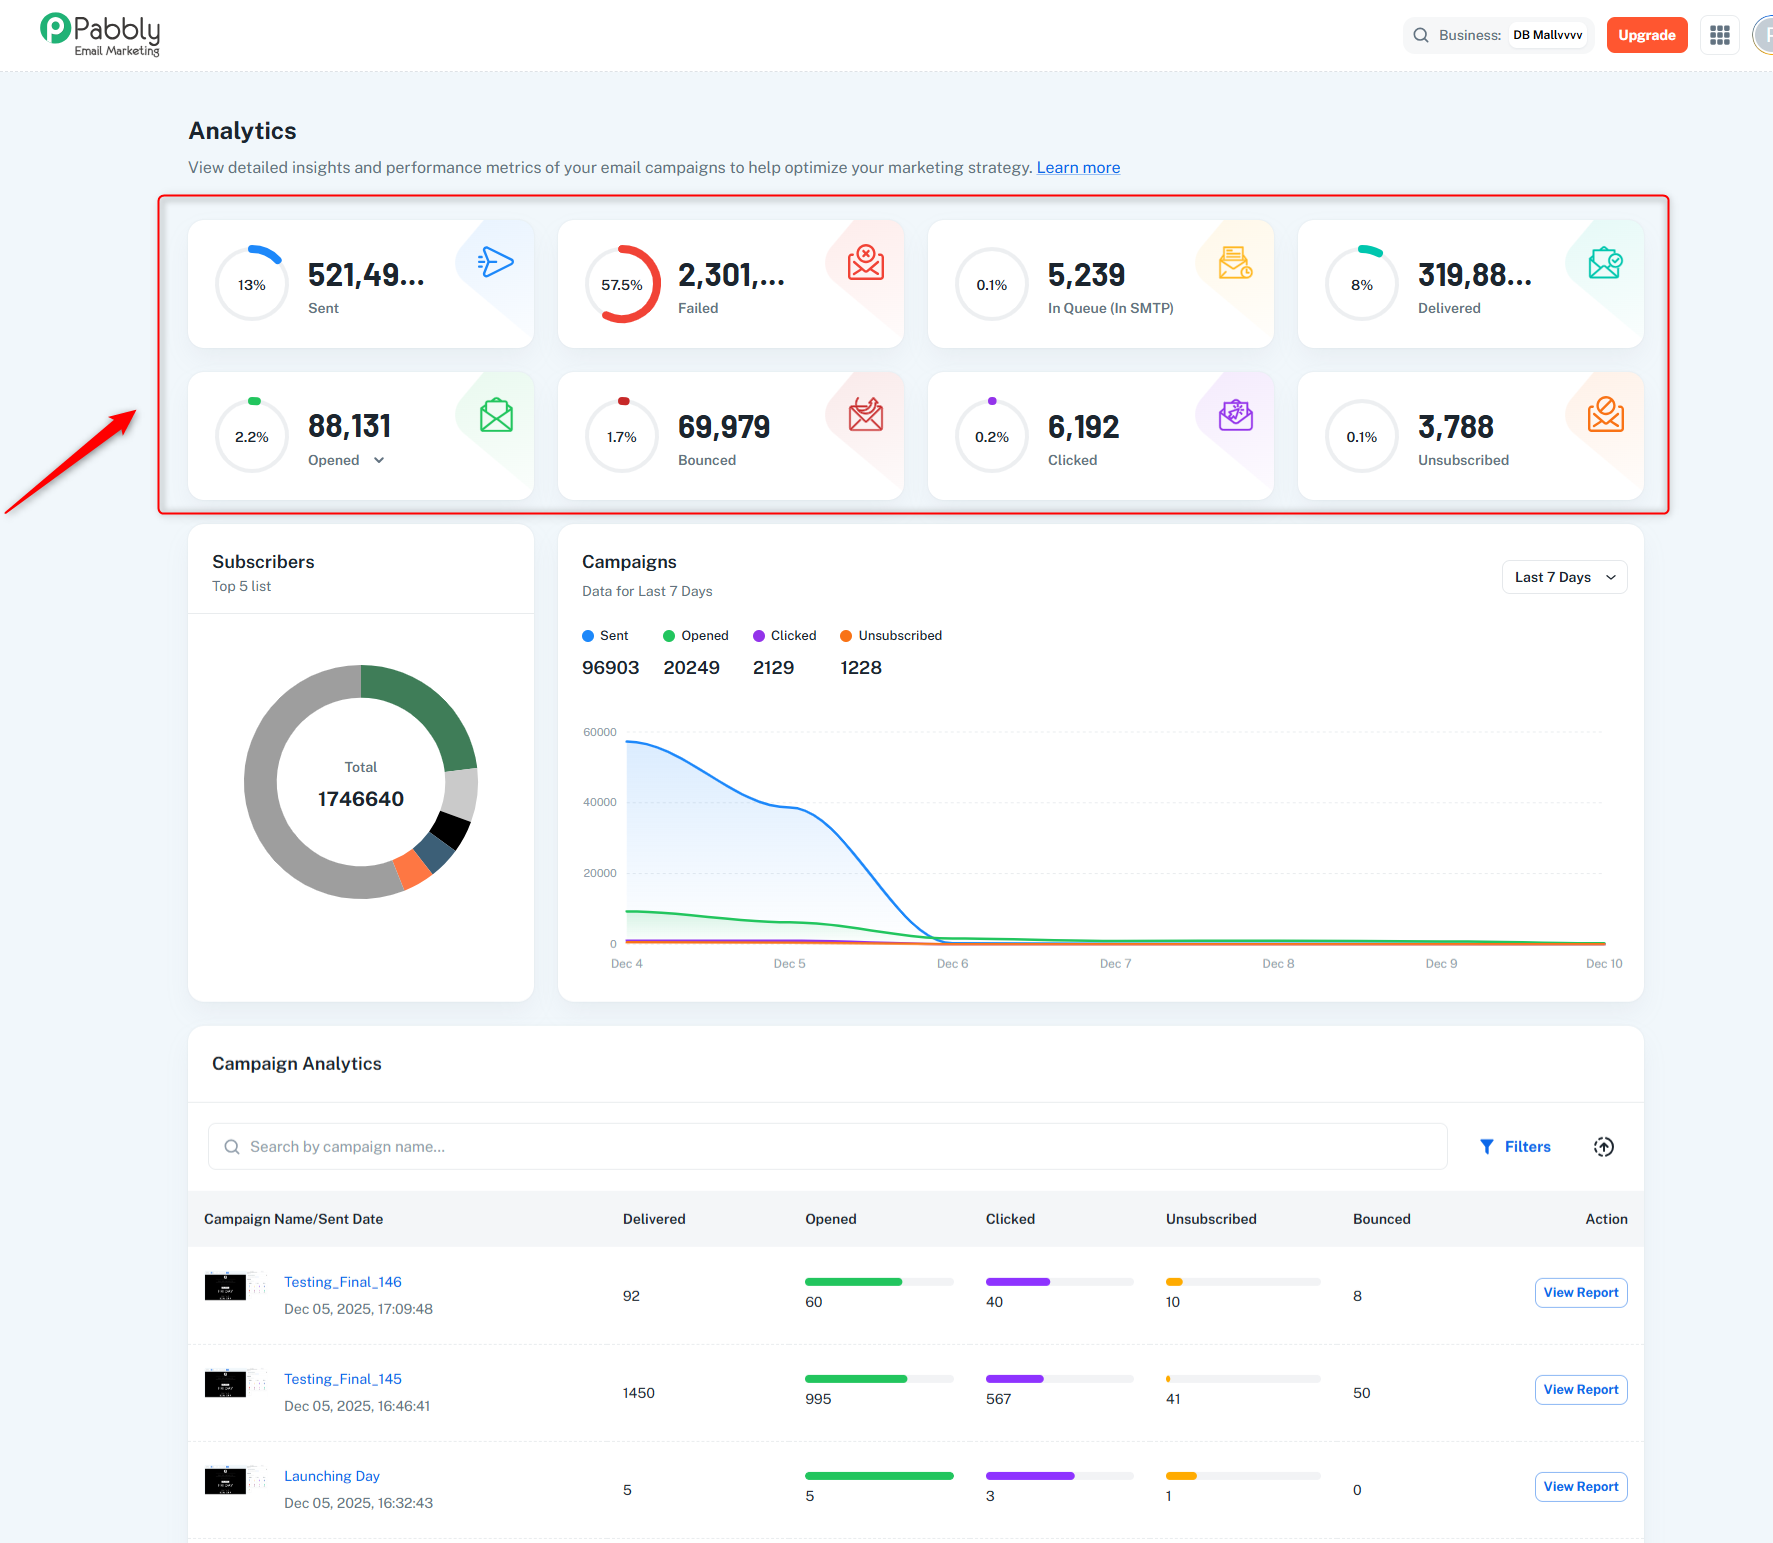
Sent: Total emails accepted by the system
Failed: Emails that failed during processing
In Queue: Emails awaiting delivery on SMTP server
Delivered: Successfully delivered emails
Bounced: Rejected or failed emails (hard/soft bounces)
Opens Analytics: Toggleable card showing "Opened" (total opens) or "Unique Opens" (unique recipients)
Clicked: Unique link clicks in emails
Unsubscribed: Recipients who opted out
Default Period: Last 31 days
Display: Each card shows count and percentage relative to total subscribers
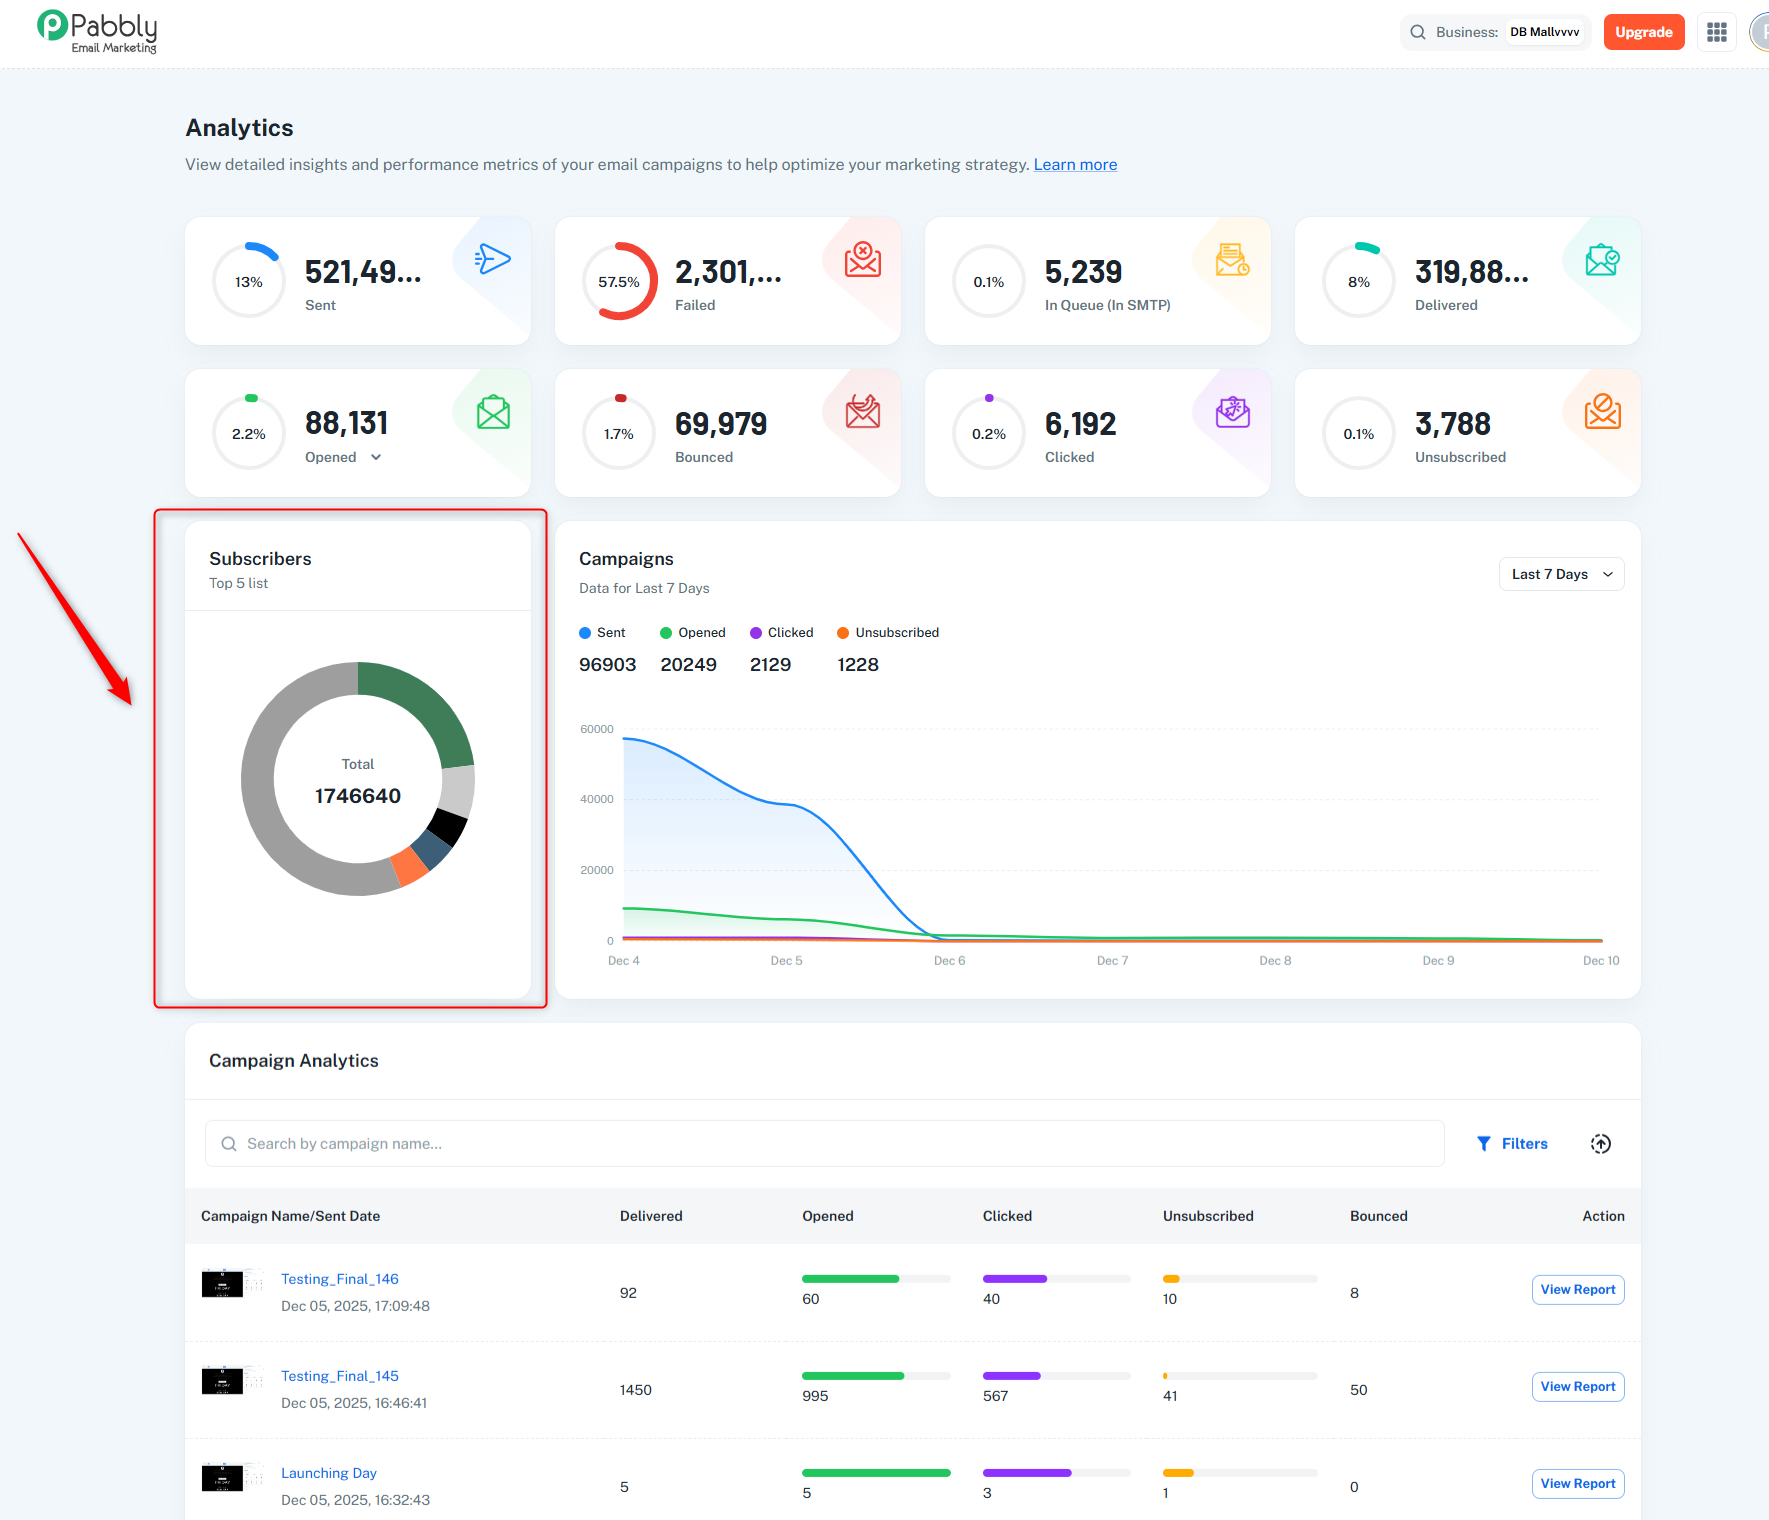
Purpose: Visual breakdown of subscriber distribution.
Shows: Top 5 lists by subscriber count, with "Others" segment for remaining lists.
Center: Total subscribers across all lists.
Use Case: Quickly see which lists have the most subscribers.
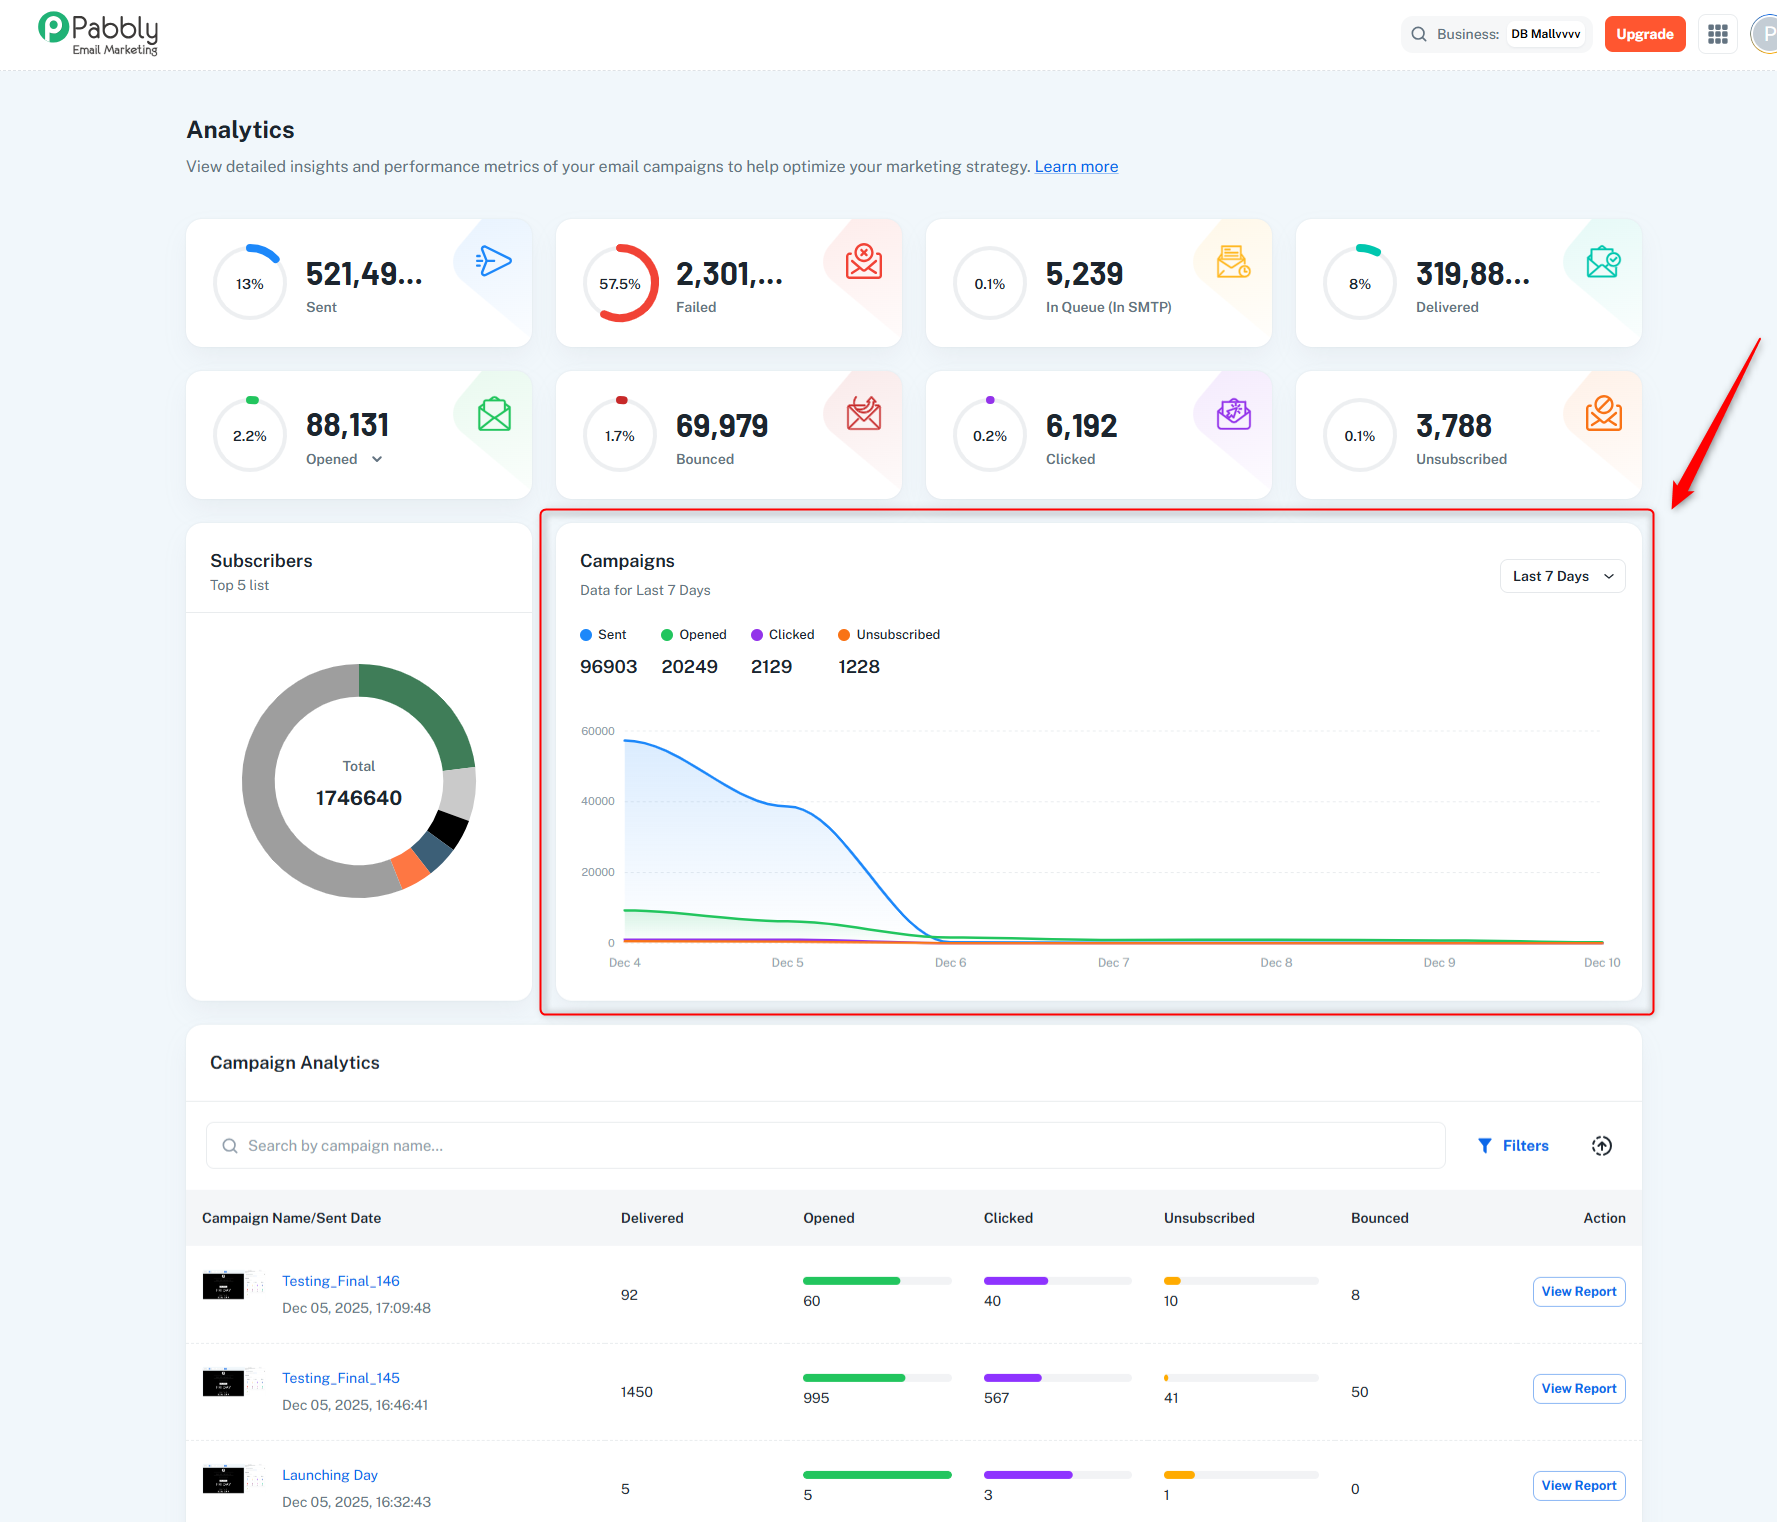
Purpose: Time-series view of campaign performance.
Metrics Tracked: Sent (blue), Opened (green), Clicked (purple), Unsubscribed (orange).
Time Ranges:
Last 7 Days: Daily data for past week.
Last 30 Days: Data for past month (optimized display).
Custom Date Range: Select any start/end date via date picker.
Features: Interactive legend, hover tooltips, automatic scaling.
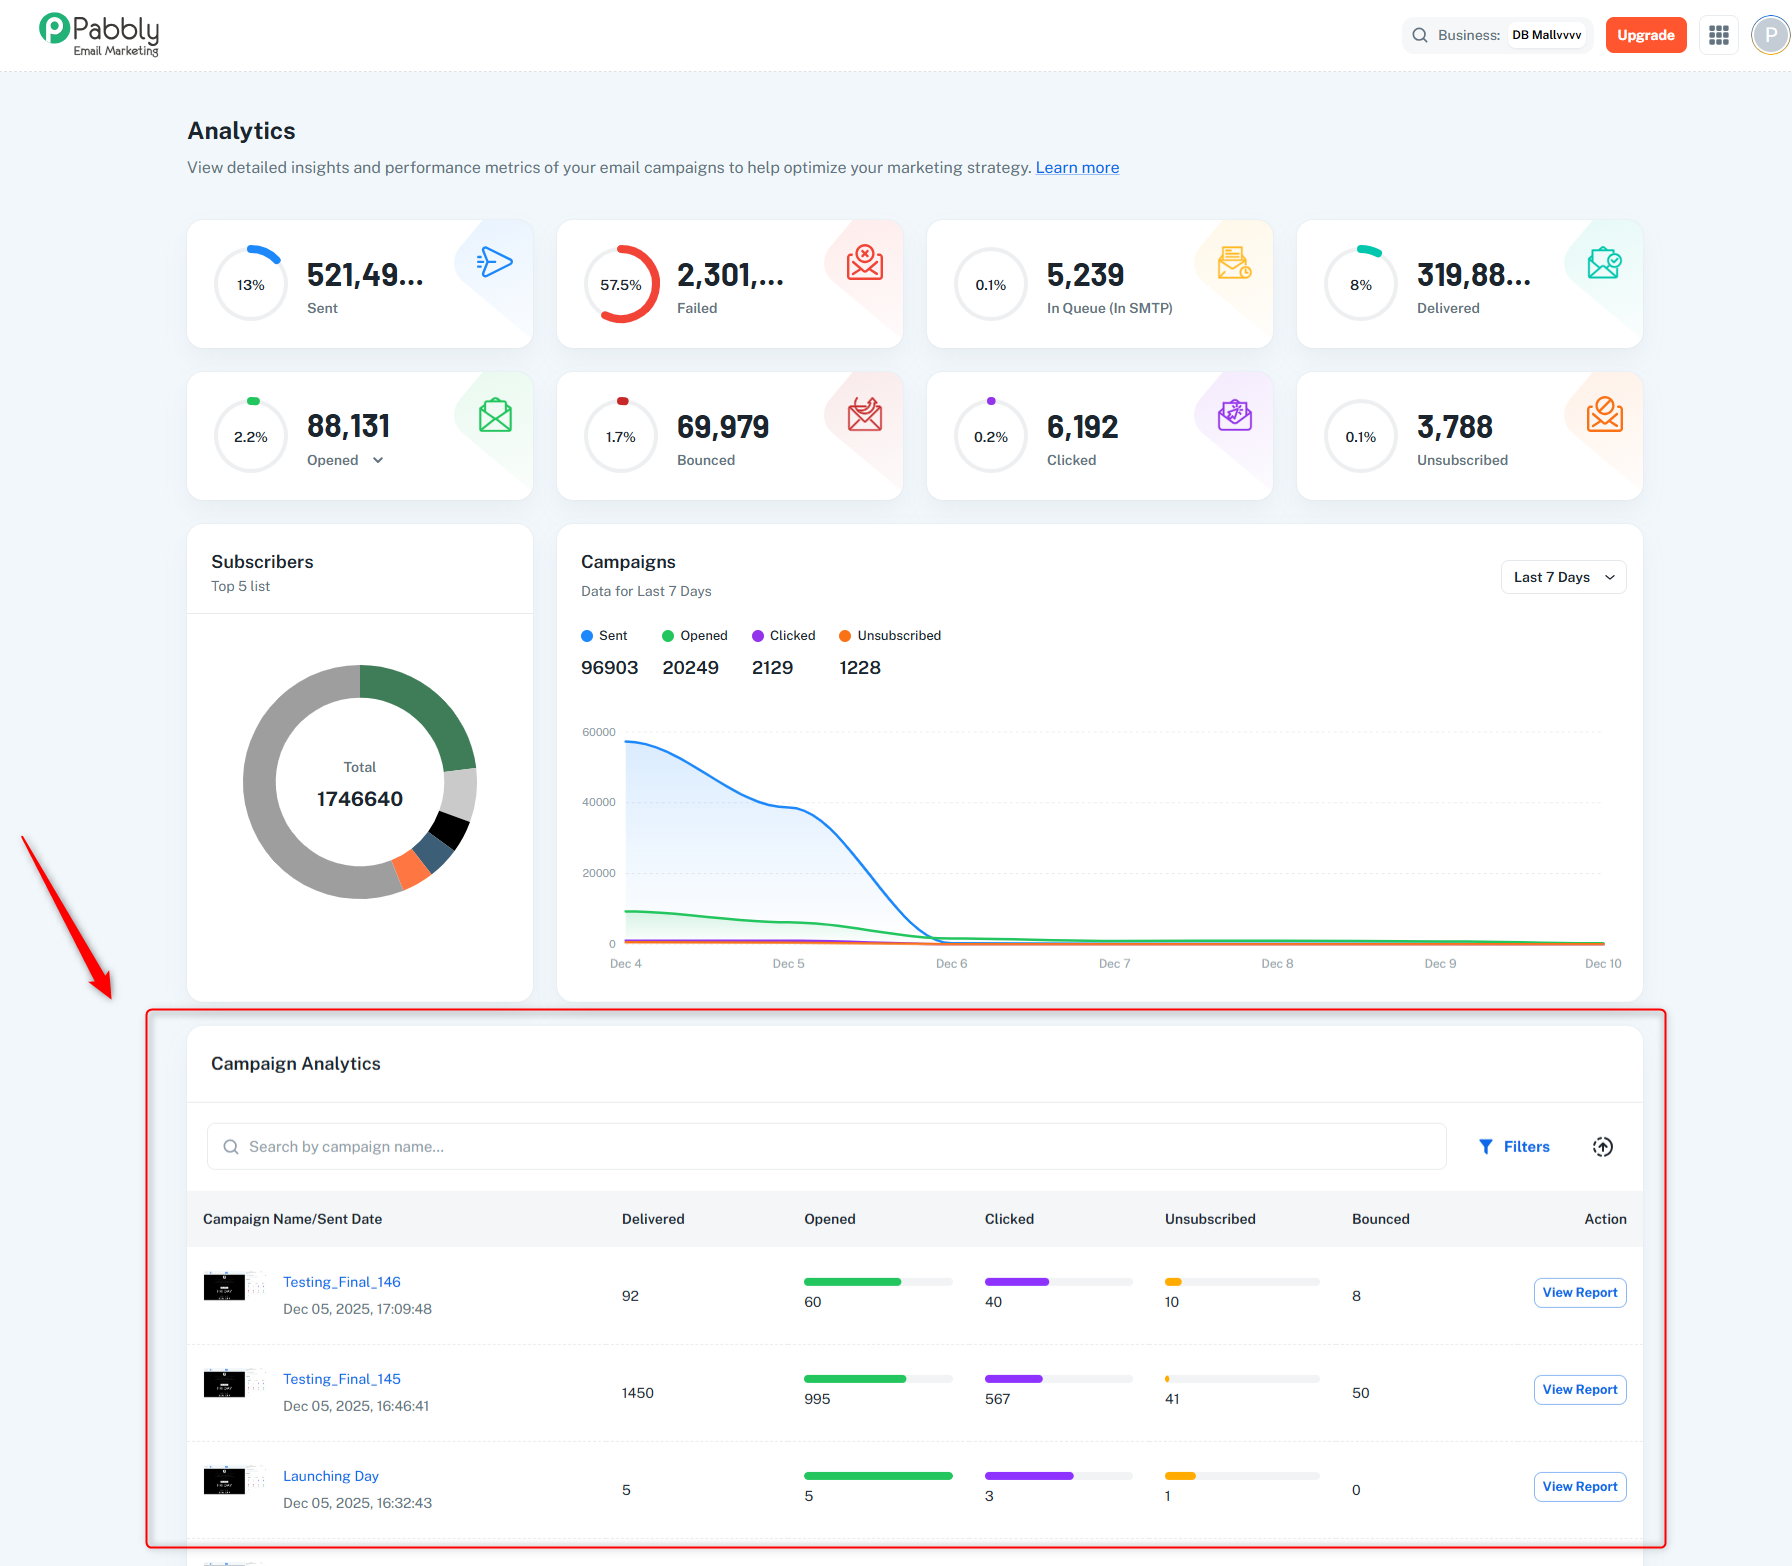
Columns:
Campaign Name/Sent Date (with campaign thumbnail image)
Delivered count
Opened count (with progress bar showing percentage)
Clicked count (with progress bar showing percentage)
Unsubscribed count (with progress bar showing percentage)
Bounced count
Action Column: Contains "View Report" button that redirects to the detailed campaign report page for that specific campaign
Three Dots Menu (⋮): Additional options menu with:
Preview: View the email content of the campaign
Features:
Search by campaign/folder name
Filter by status
Pagination (10 rows per page default)
Progress bars for Opened, Clicked, and Unsubscribed metrics
Campaign thumbnail images with hover preview
Note: The "View Report" button in the Action column navigates to a dedicated campaign report page with detailed analytics, while the three-dots menu provides quick actions like preview.
Auto-load: Loads last 31 days of data on page open.
Date Range Selection: Custom date picker for flexible analysis.
Real-time Data: Updates from campaign reports API.
Responsive Design: Adapts to mobile, tablet, and desktop.
Error Handling: Shows alerts when data fails to load.
Use the Opens Analytics card dropdown to switch between total opens and unique opens.
Use custom date ranges to analyze specific campaign periods.
Click chart legend items to show/hide specific metrics.
Use the table search to find specific campaigns quickly.
Click "View Report" in the Action column to see detailed analytics for a specific campaign.
Use the three-dots menu to preview email content.
Check bounce rates to maintain list quality.
Hover over campaign thumbnails to see the preview icon.