Help Guide
 Pabbly Connect Team•Updated Oct 12, 2026•9 min read
Use Google Analytics 4 (GA4) in Pabbly Connect to read reports from a property and send events into GA4, such as a purchase from your CRM. No coding is needed.
Property ID is a number, e.g. 1335885. Reports need it.
Measurement ID looks like G-XXXXXXXXXX. Sending events needs it.
Words you'll see
Metric: a number, such as visitors (activeUsers) or visits (sessions).
Dimension: a way to split that number, such as by date or country.
JSON: text inside { } brackets. Copy it as shown and change only the values.
Click Create Workflow and name it, e.g. "Daily GA4 visitors".
Trigger: Schedule by Pabbly, every day at 8:00 AM.
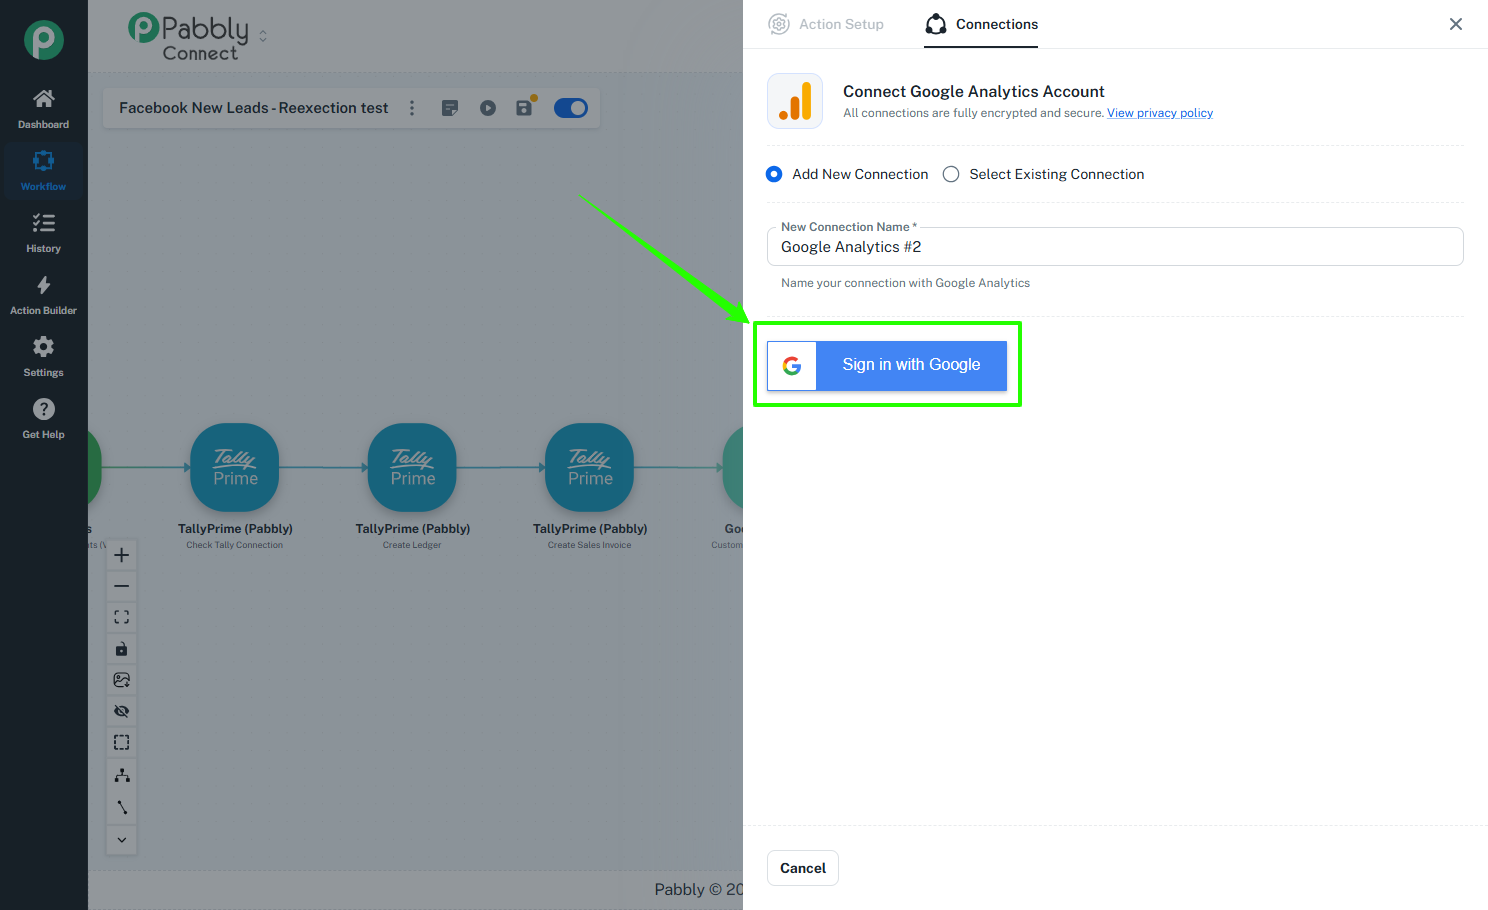
Action: Google Analytics → Run Report (GA4). Click Connect and sign in with Google.
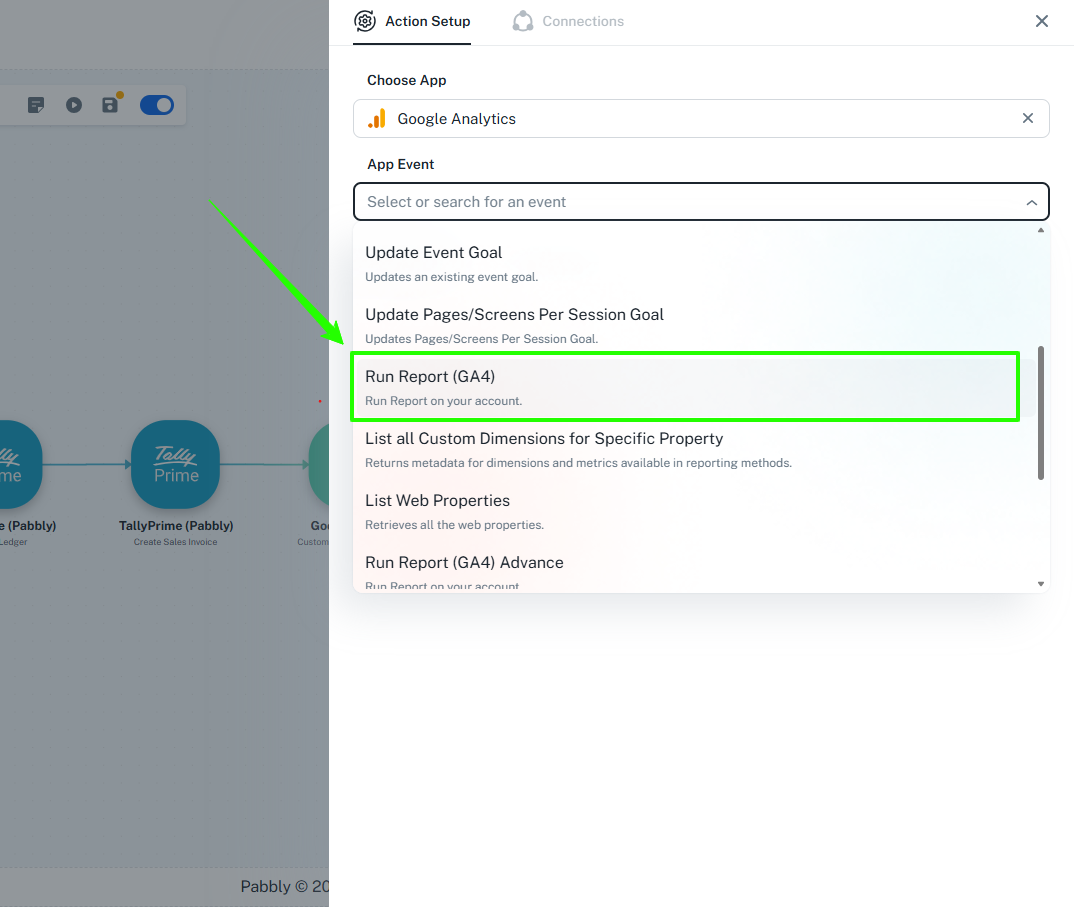
Fill in:
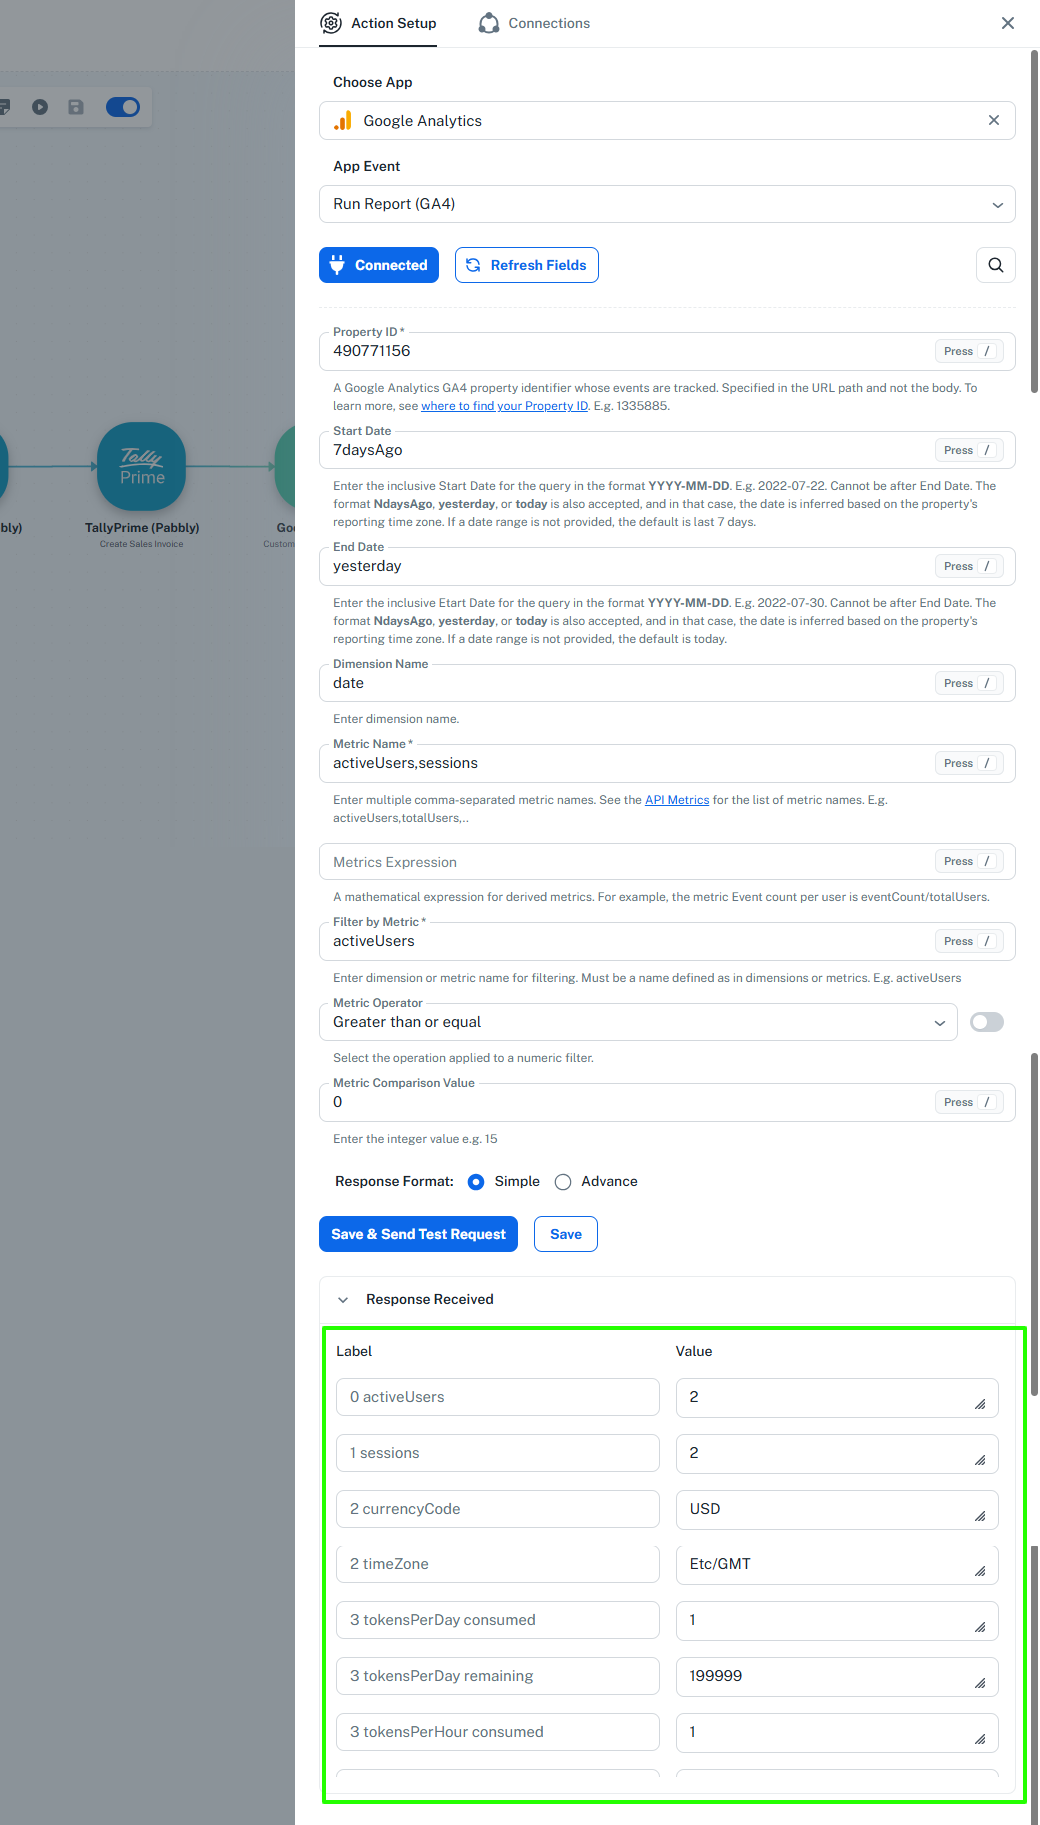
Property ID: your GA4 property ID
Start Date and End Date: yesterday
Metric Name: activeUsers,sessions
Filter by Metric: activeUsers, Metric Operator: Greater than or equal, Metric Comparison Value: 0
Click Save & Send Test Request. Your numbers appear in the response as fields like 0 activeUsers (visitors) and 1 sessions (visits).
Action: Google Sheets → Add New Row. Map the metric values into your sheet columns.
Test, then turn the workflow On.
Google Analytics connects with Google sign-in (OAuth).
You need
A Google account that can see your GA4 property, with the Viewer role or higher.
Your Property ID, for reports. See Find your Property ID below.
Your Measurement ID and an API Secret, only if you want to send events. See Find your Measurement ID and API Secret below.
Find your Property ID
Go to analytics.google.com and sign in.
At the top left, check that the correct account and property are selected. Click the name to switch.
Click Admin (the gear icon at the bottom left).
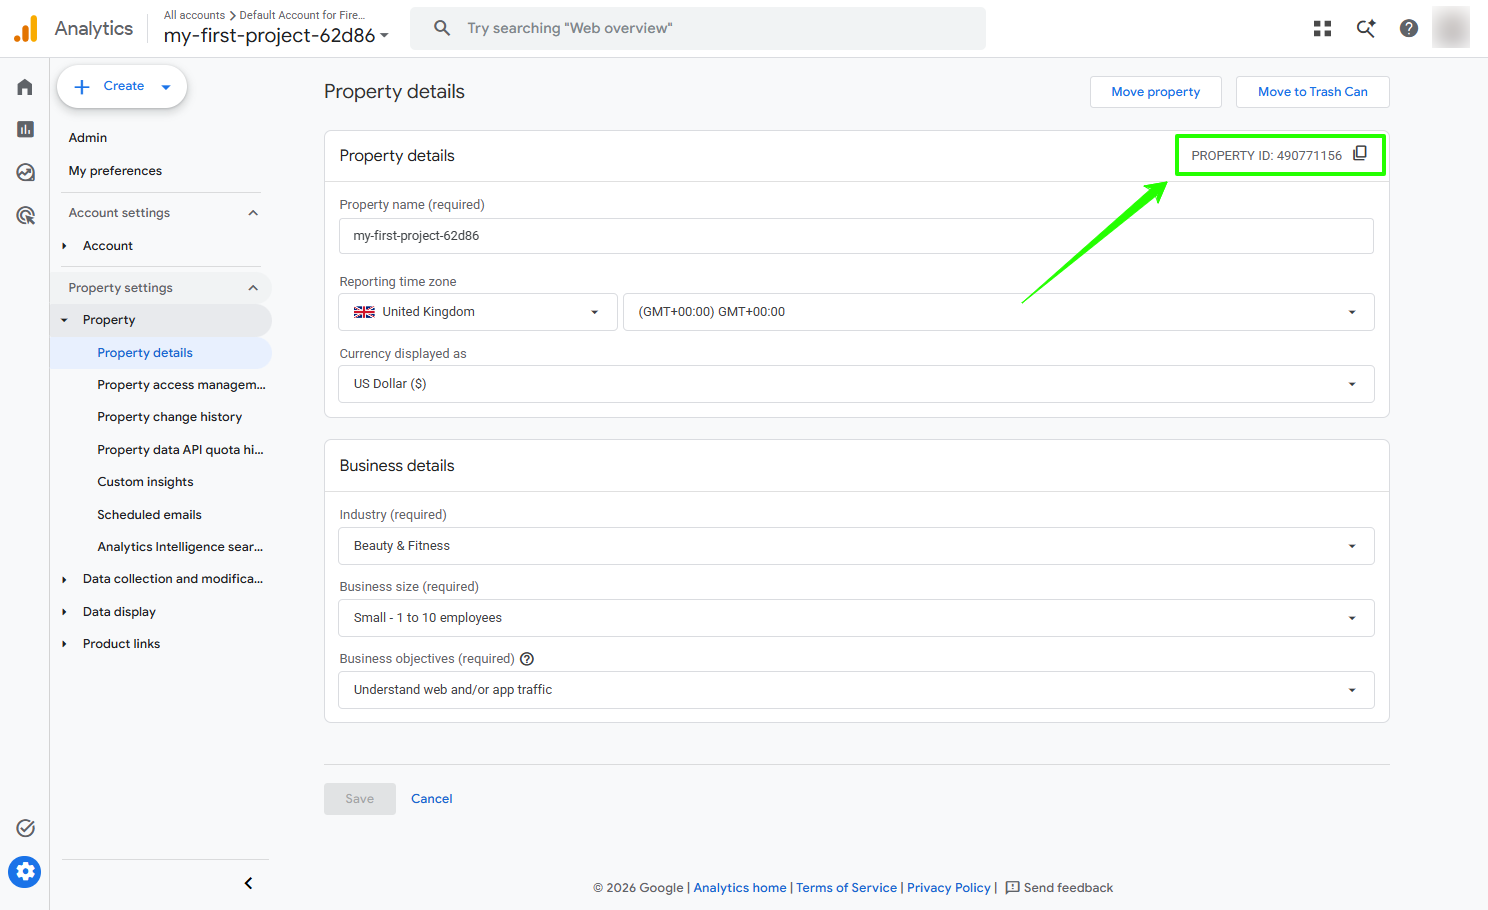
In the left menu, open Property settings → Property → Property details.
At the top right you'll see PROPERTY ID, e.g. 490771156. Click the copy icon next to it.
Find your Measurement ID and API Secret
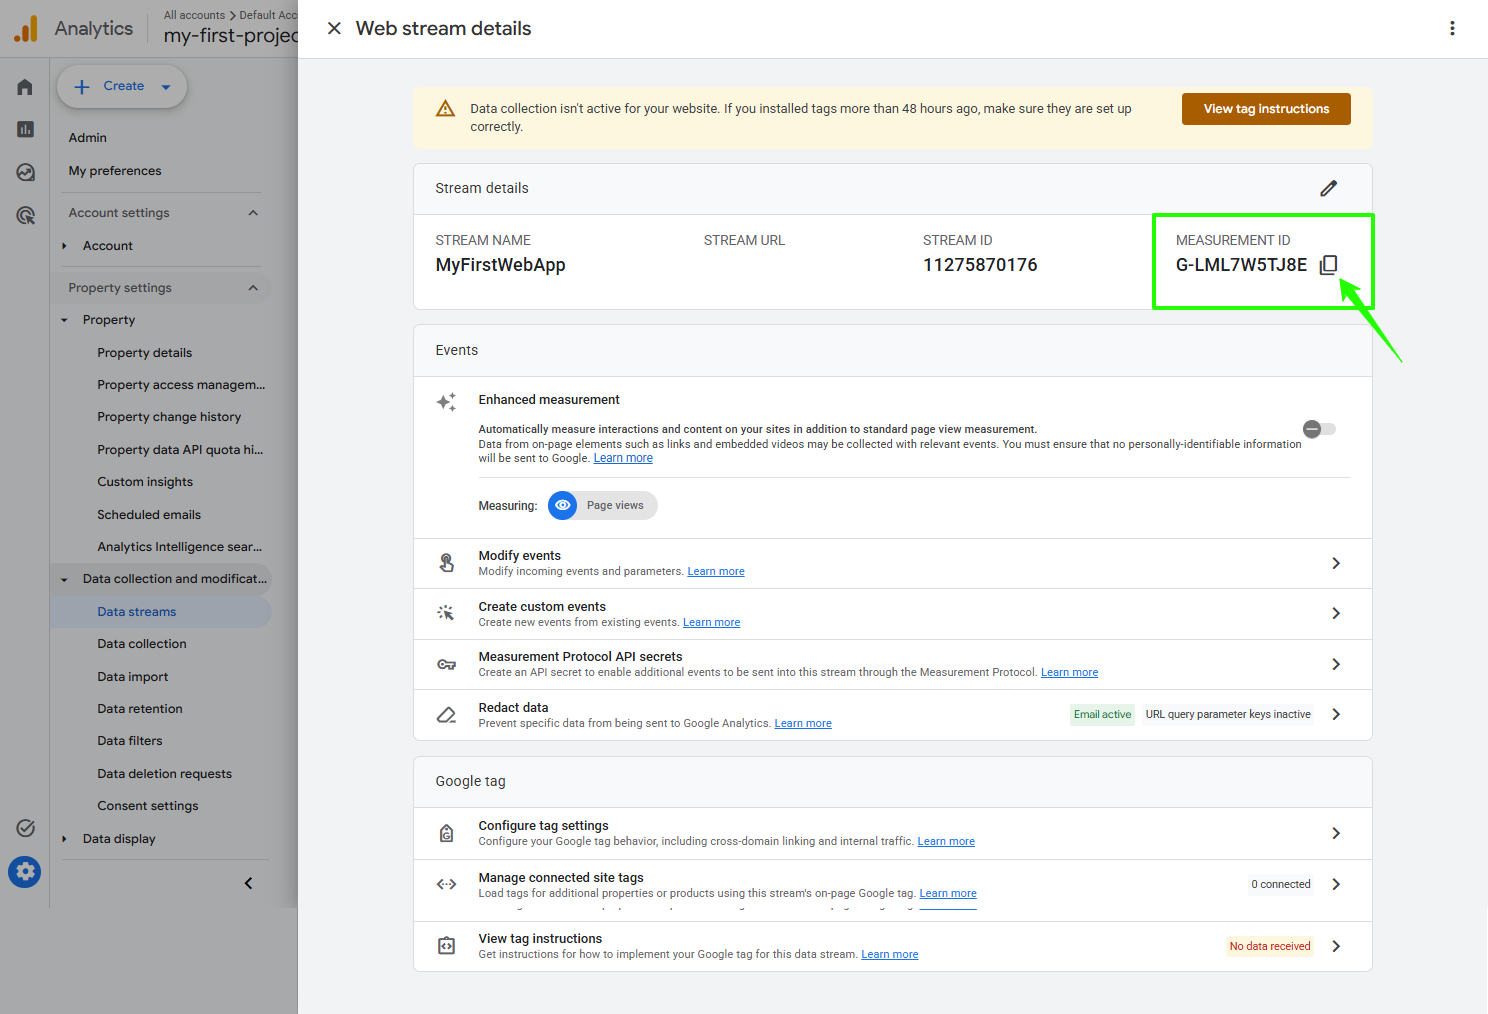
In Admin, under Data collection and modification, click Data streams.
Click your Web stream.
Under Stream details, copy the Measurement ID. It starts with G-.
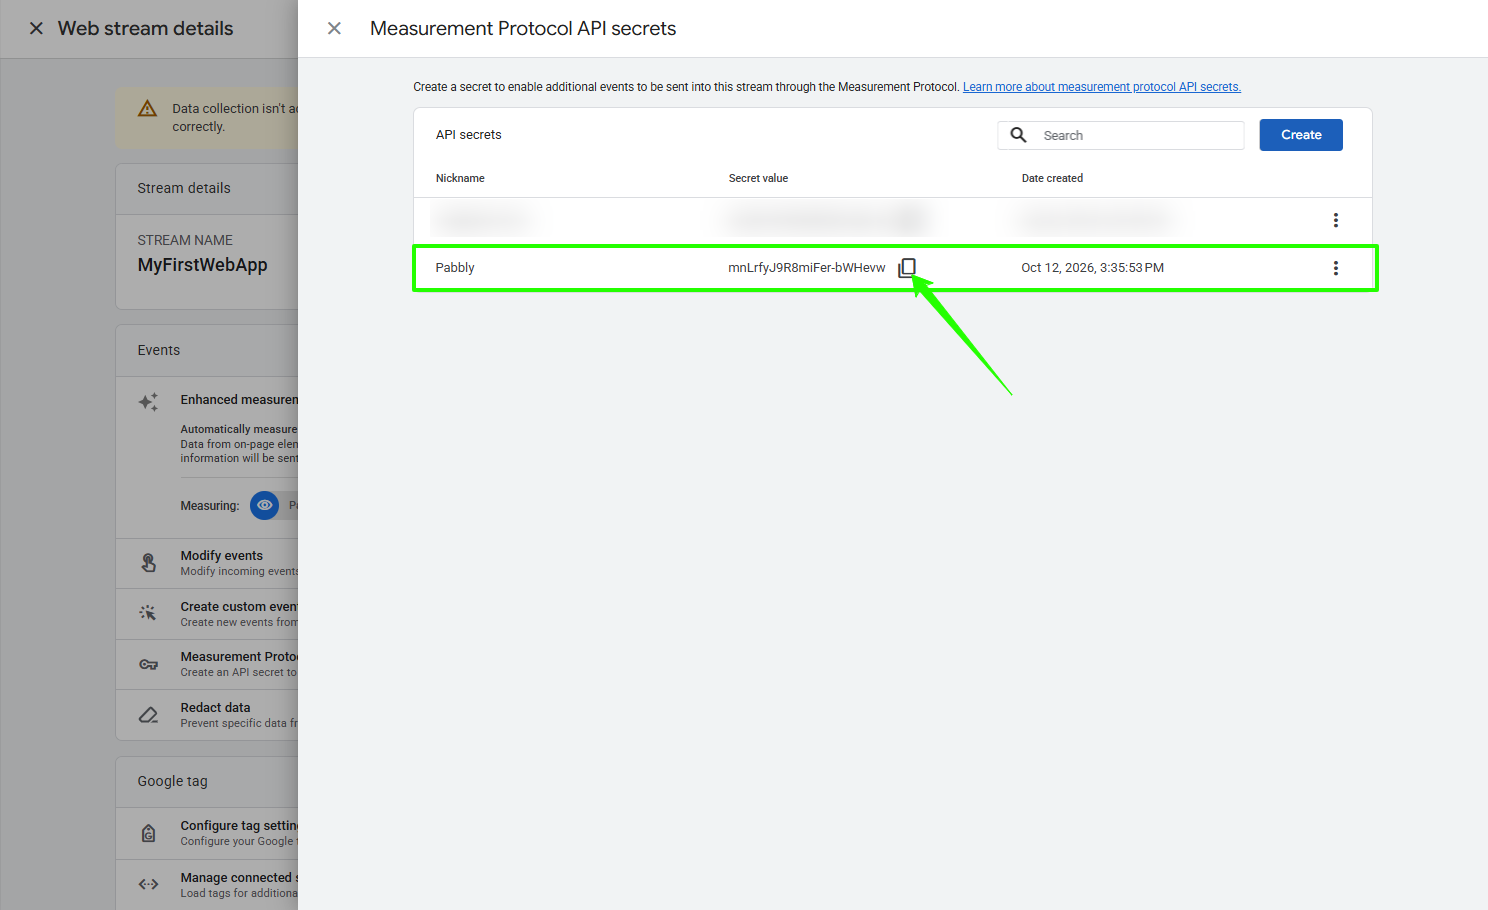
On the same page, click Measurement Protocol API secrets.
Click Create, type a nickname such as Pabbly, and click Create.
Copy the Secret value.
If you don't see Admin or Create, your role is too low. Ask the property's administrator to give you access.
Connect in Pabbly Connect
In your workflow, add an action step and choose Google Analytics as the app.
Choose an action event, then click Connect.
Select Add New Connection and give it a name, e.g. "My GA4".
Click the Google sign-in button and choose the Google account from above.
On Google's permission screen, tick every checkbox if any are shown, then click Allow.
Click Save. The connection is ready and you can pick it again in other steps.
Action | What it does |
|---|---|
Run Report (GA4) | Metrics for a date range, with one optional dimension and a number filter |
Run Report (GA4) Advance | Any report you write as JSON: several dimensions, sorting, complex filters |
List all Custom Dimensions for Specific Property | Every dimension and metric name the property supports |
List Web Properties | All properties in an Analytics account |
Create Event Tracking Measurement (GA4) | Sends a custom event into GA4 |
To start a workflow from GA4 data, use Schedule by Pabbly as the trigger. To send GA4 an event from another app, use that app's trigger with Create Event Tracking Measurement (GA4).
Field | Required | Enter |
|---|---|---|
Property ID | Yes | Numeric ID, e.g. |
Start Date | No (default |
|
End Date | No (default | Same formats. Not before Start Date |
Dimension Name | No | One dimension, e.g. |
Metric Name | Yes (default | Comma-separated, e.g. |
Metrics Expression | No | A formula, e.g. |
Filter by Metric | Yes | One of your metrics, e.g. |
Metric Operator | No | Greater than, Less than, Equals, Less than or equal, Greater than or equal |
Metric Comparison Value | No (default | A whole number. Rows that fail the comparison are dropped |
For totals with no filtering, use your first metric, Greater than or equal, and 0.
Sample output (trimmed)
{
  "dimensionHeaders": [{ "name": "date" }],
  "metricHeaders": [
    { "name": "activeUsers", "type": "TYPE_INTEGER" },
    { "name": "sessions", "type": "TYPE_INTEGER" }
  ],
  "rows": [
    { "dimensionValues": [{ "value": "20260919" }], "metricValues": [{ "value": "412" }, { "value": "530" }] },
    { "dimensionValues": [{ "value": "20260920" }], "metricValues": [{ "value": "388" }, { "value": "497" }] }
  ],
  "rowCount": 7
}
In Pabbly's Simple response format, each metric appears as its own field, numbered in the order of Metric Name, e.g. 0 activeUsers = 2 and 1 sessions = 2. The response also shows your quota use, e.g. tokensPerDay remaining. Use an Iterator if you add a Dimension and want one row per run.
Field | Required | Enter |
|---|---|---|
Property ID | Yes | Numeric ID |
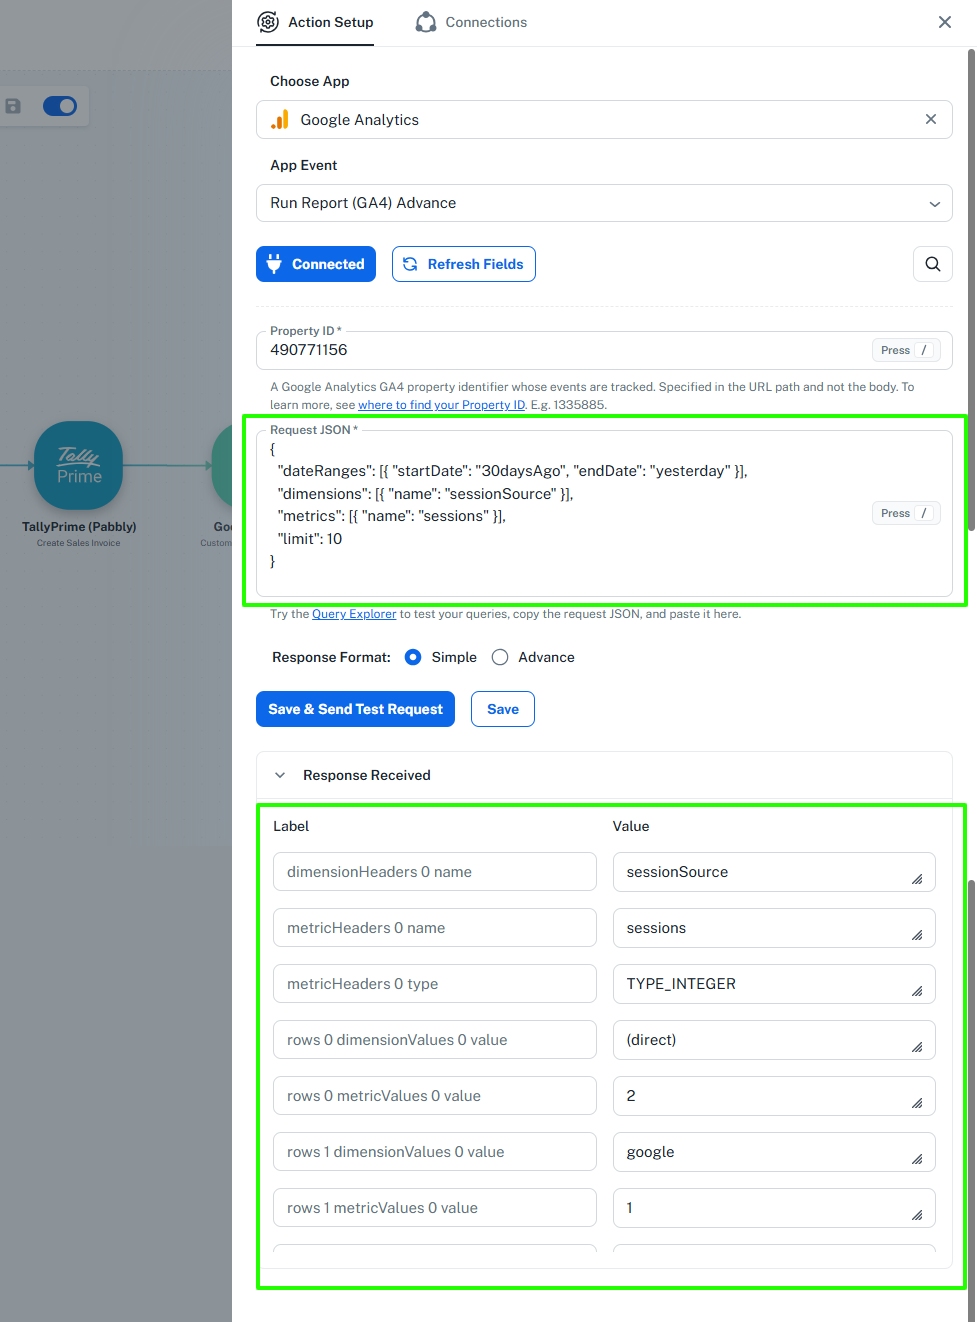
Request JSON | Yes | Build it in Google's Query Explorer, then paste the request JSON. You can map values into it |
Example request:
{
  "dateRanges": [{ "startDate": "30daysAgo", "endDate": "yesterday" }],
  "dimensions": [{ "name": "sessionSource" }, { "name": "sessionMedium" }],
  "metrics": [{ "name": "sessions" }, { "name": "conversions" }],
  "orderBys": [{ "metric": { "metricName": "sessions" }, "desc": true }],
  "limit": 10
}
The output looks like Run Report (GA4).
Each row comes back as fields like rows 0 dimensionValues 0 value (e.g. (direct)) and rows 0 metricValues 0 value (e.g. 2).
Needs only the Property ID. Use the apiName values it returns in Run Report.
{
  "dimensions": [
    { "apiName": "country", "uiName": "Country" },
    { "apiName": "customEvent:plan_type", "uiName": "Plan type", "customDefinition": true }
  ],
  "metrics": [{ "apiName": "activeUsers", "uiName": "Active users" }]
}
Choose the Google Analytics Account. The number after properties/ in each result is the Property ID.
{ "properties": [{ "name": "properties/1335885", "displayName": "Acme Website", "timeZone": "Asia/Kolkata", "currencyCode": "INR" }] }
Uses the Measurement ID and API Secret, not the connection.
Field | Required | Enter |
|---|---|---|
Measurement ID | Yes | e.g. |
API Secret | Yes | From Measurement Protocol API secrets |
Client ID | Yes | A unique ID for the visitor, e.g. |
User ID | No | Your logged-in user ID, e.g. |
Event Name | Yes | e.g. |
Event Parameters | Yes | JSON, up to 25 parameters, e.g. |
User Property Key | No | Comma-separated names, e.g. |
Pabbly Custom Fields | No | The value for each User Property Key, e.g. |
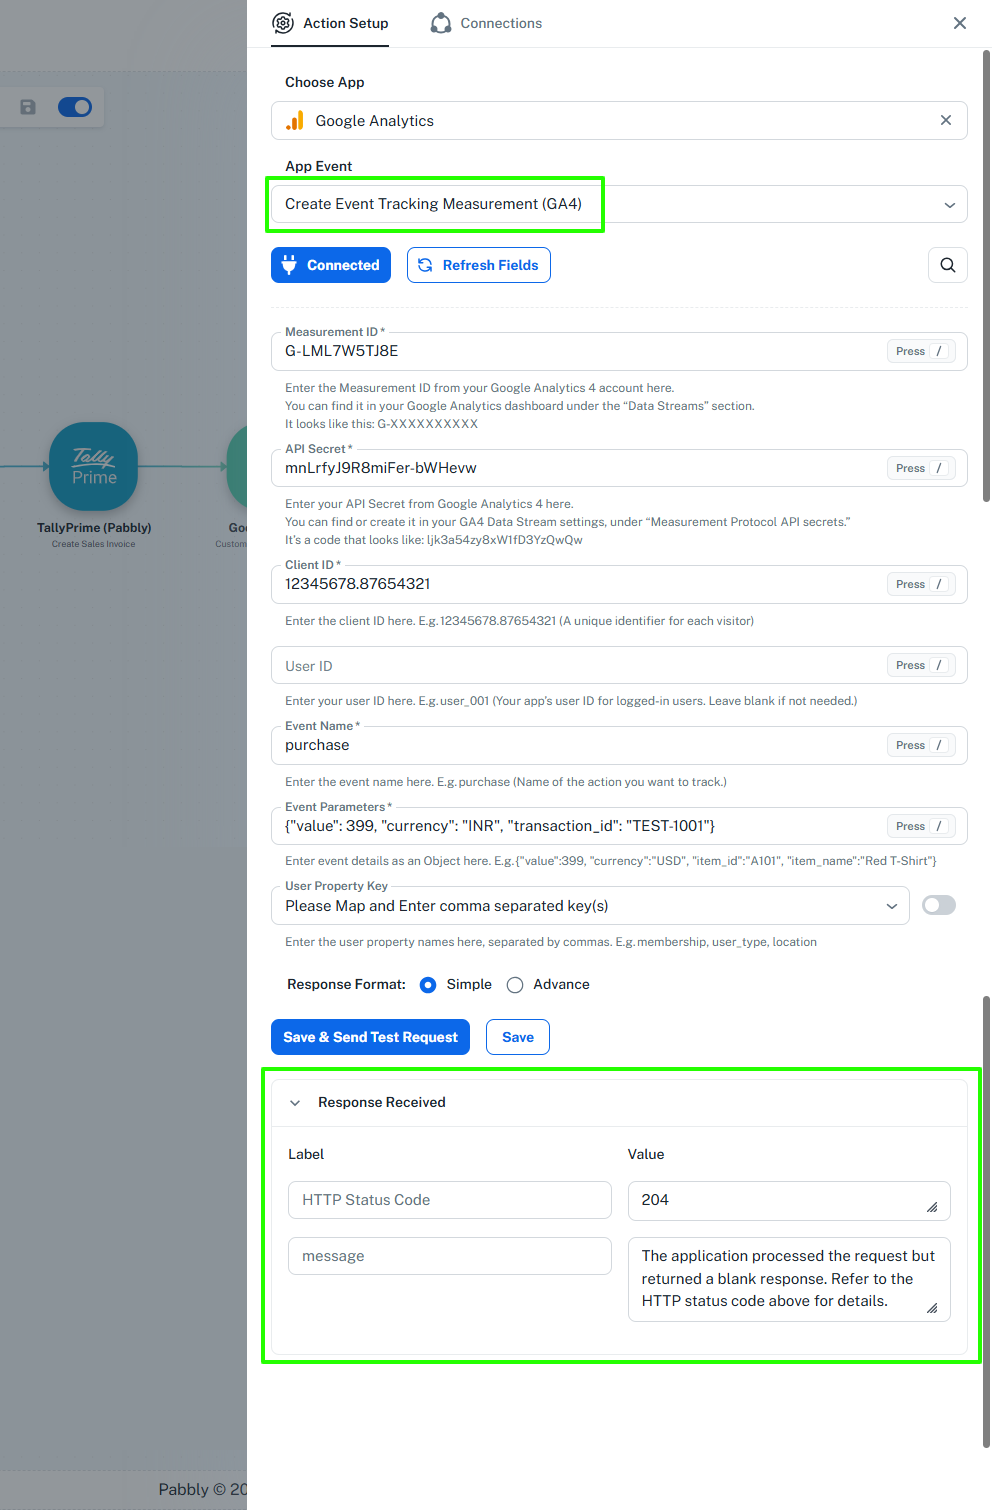
The response is always empty (HTTP 204), even if Google rejects the event. Check GA4 Realtime or DebugView.
Events show in Realtime within a minute, and in standard reports after 24 to 48 hours.
A successful send shows HTTP Status Code 204 and the message "The application processed the request but returned a blank response". That's expected.
Goal | Trigger | Steps |
|---|---|---|
Daily traffic in Google Sheets | Schedule, daily | Run Report (GA4), Dimension |
Weekly top 10 sources to Slack | Schedule, Monday | Run Report (GA4) Advance → Text Formatter → Slack |
CRM sale as a GA4 purchase | HubSpot, Pipedrive: Deal Won | Create Event Tracking Measurement (GA4), Event Name |
Track form submissions | Typeform, Jotform: New Submission | Create Event Tracking Measurement (GA4), Event Name |
Alert on low traffic | Schedule, daily | Run Report (GA4) for yesterday → Filter activeUsers < 100 → email or WhatsApp |
Find field names | Manual run | List Web Properties → List all Custom Dimensions |
CRM sale example
Trigger: your CRM's deal-won event.
Action: Create Event Tracking Measurement (GA4) with your Measurement ID and API Secret.
Client ID: the GA client ID saved on the contact, or any stable unique ID.
Event Name purchase. Event Parameters: {"value": 399, "currency": "USD", "transaction_id": "D-101"}. Then delete 399 and D-101 and map the deal amount and deal ID from your trigger in their place.
Test, then check GA4 Realtime.
Find out what went wrong
In Pabbly Connect, open Task History and click the run that failed.
Open the step with the red mark. The response shows the error message from Google.
Find that message in the table below and apply the fix.
Open the step again and click Save & Send Test Request to check it works.
Problem | Cause | Fix |
|---|---|---|
403 | No Viewer access, or Property ID from another account | Check Admin → Property access management, or reconnect |
400 | Misspelled or incompatible metric or dimension | Copy exact names from List all Custom Dimensions |
400 on Run Report (GA4) Advance | Invalid JSON, often a mapped value with a quote | Paste the JSON into Query Explorer to check it. Remove quote marks (") from mapped text, e.g. with a Text Formatter step |
Property ID rejected | Measurement ID or account ID entered | Use the numeric Property ID |
Empty | No data, or the filter dropped all rows | Widen dates. Use Greater than or equal |
Event not in GA4 | Wrong Measurement ID or API Secret, bad JSON, or not processed yet | Check the IDs and Realtime. While testing, add |
Empty account dropdown | No GA4 account on this Google login | Sign in with an account that has GA4 |
Numbers differ from GA4 | Sampling, thresholds, or time zone | Compare the same range in Explore |
Step worked before, now fails with 401 or invalid_grant | Google sign-in expired, the password changed, or access was removed | Add a new connection with the same Google account and choose it in the step |
FAQs
Several properties at once: List Web Properties → Iterator → Run Report.
Limits: standard properties get 200,000 tokens a day, 40,000 an hour, and 10 requests at once. Analytics 360 properties get higher limits. A simple report uses a few tokens. The response shows propertyQuota when you near the limit.
Tasks: each run is one task.
Several events: one event per run. Use an Iterator.
Field names match the Pabbly Connect builder as of 12 October 2026. Google behaviour is from Google's documentation: